Calendar
Your trading history as a month grid of daily P&L, with the month's numbers, all-time streaks and weekday records, and a shareable calendar card.
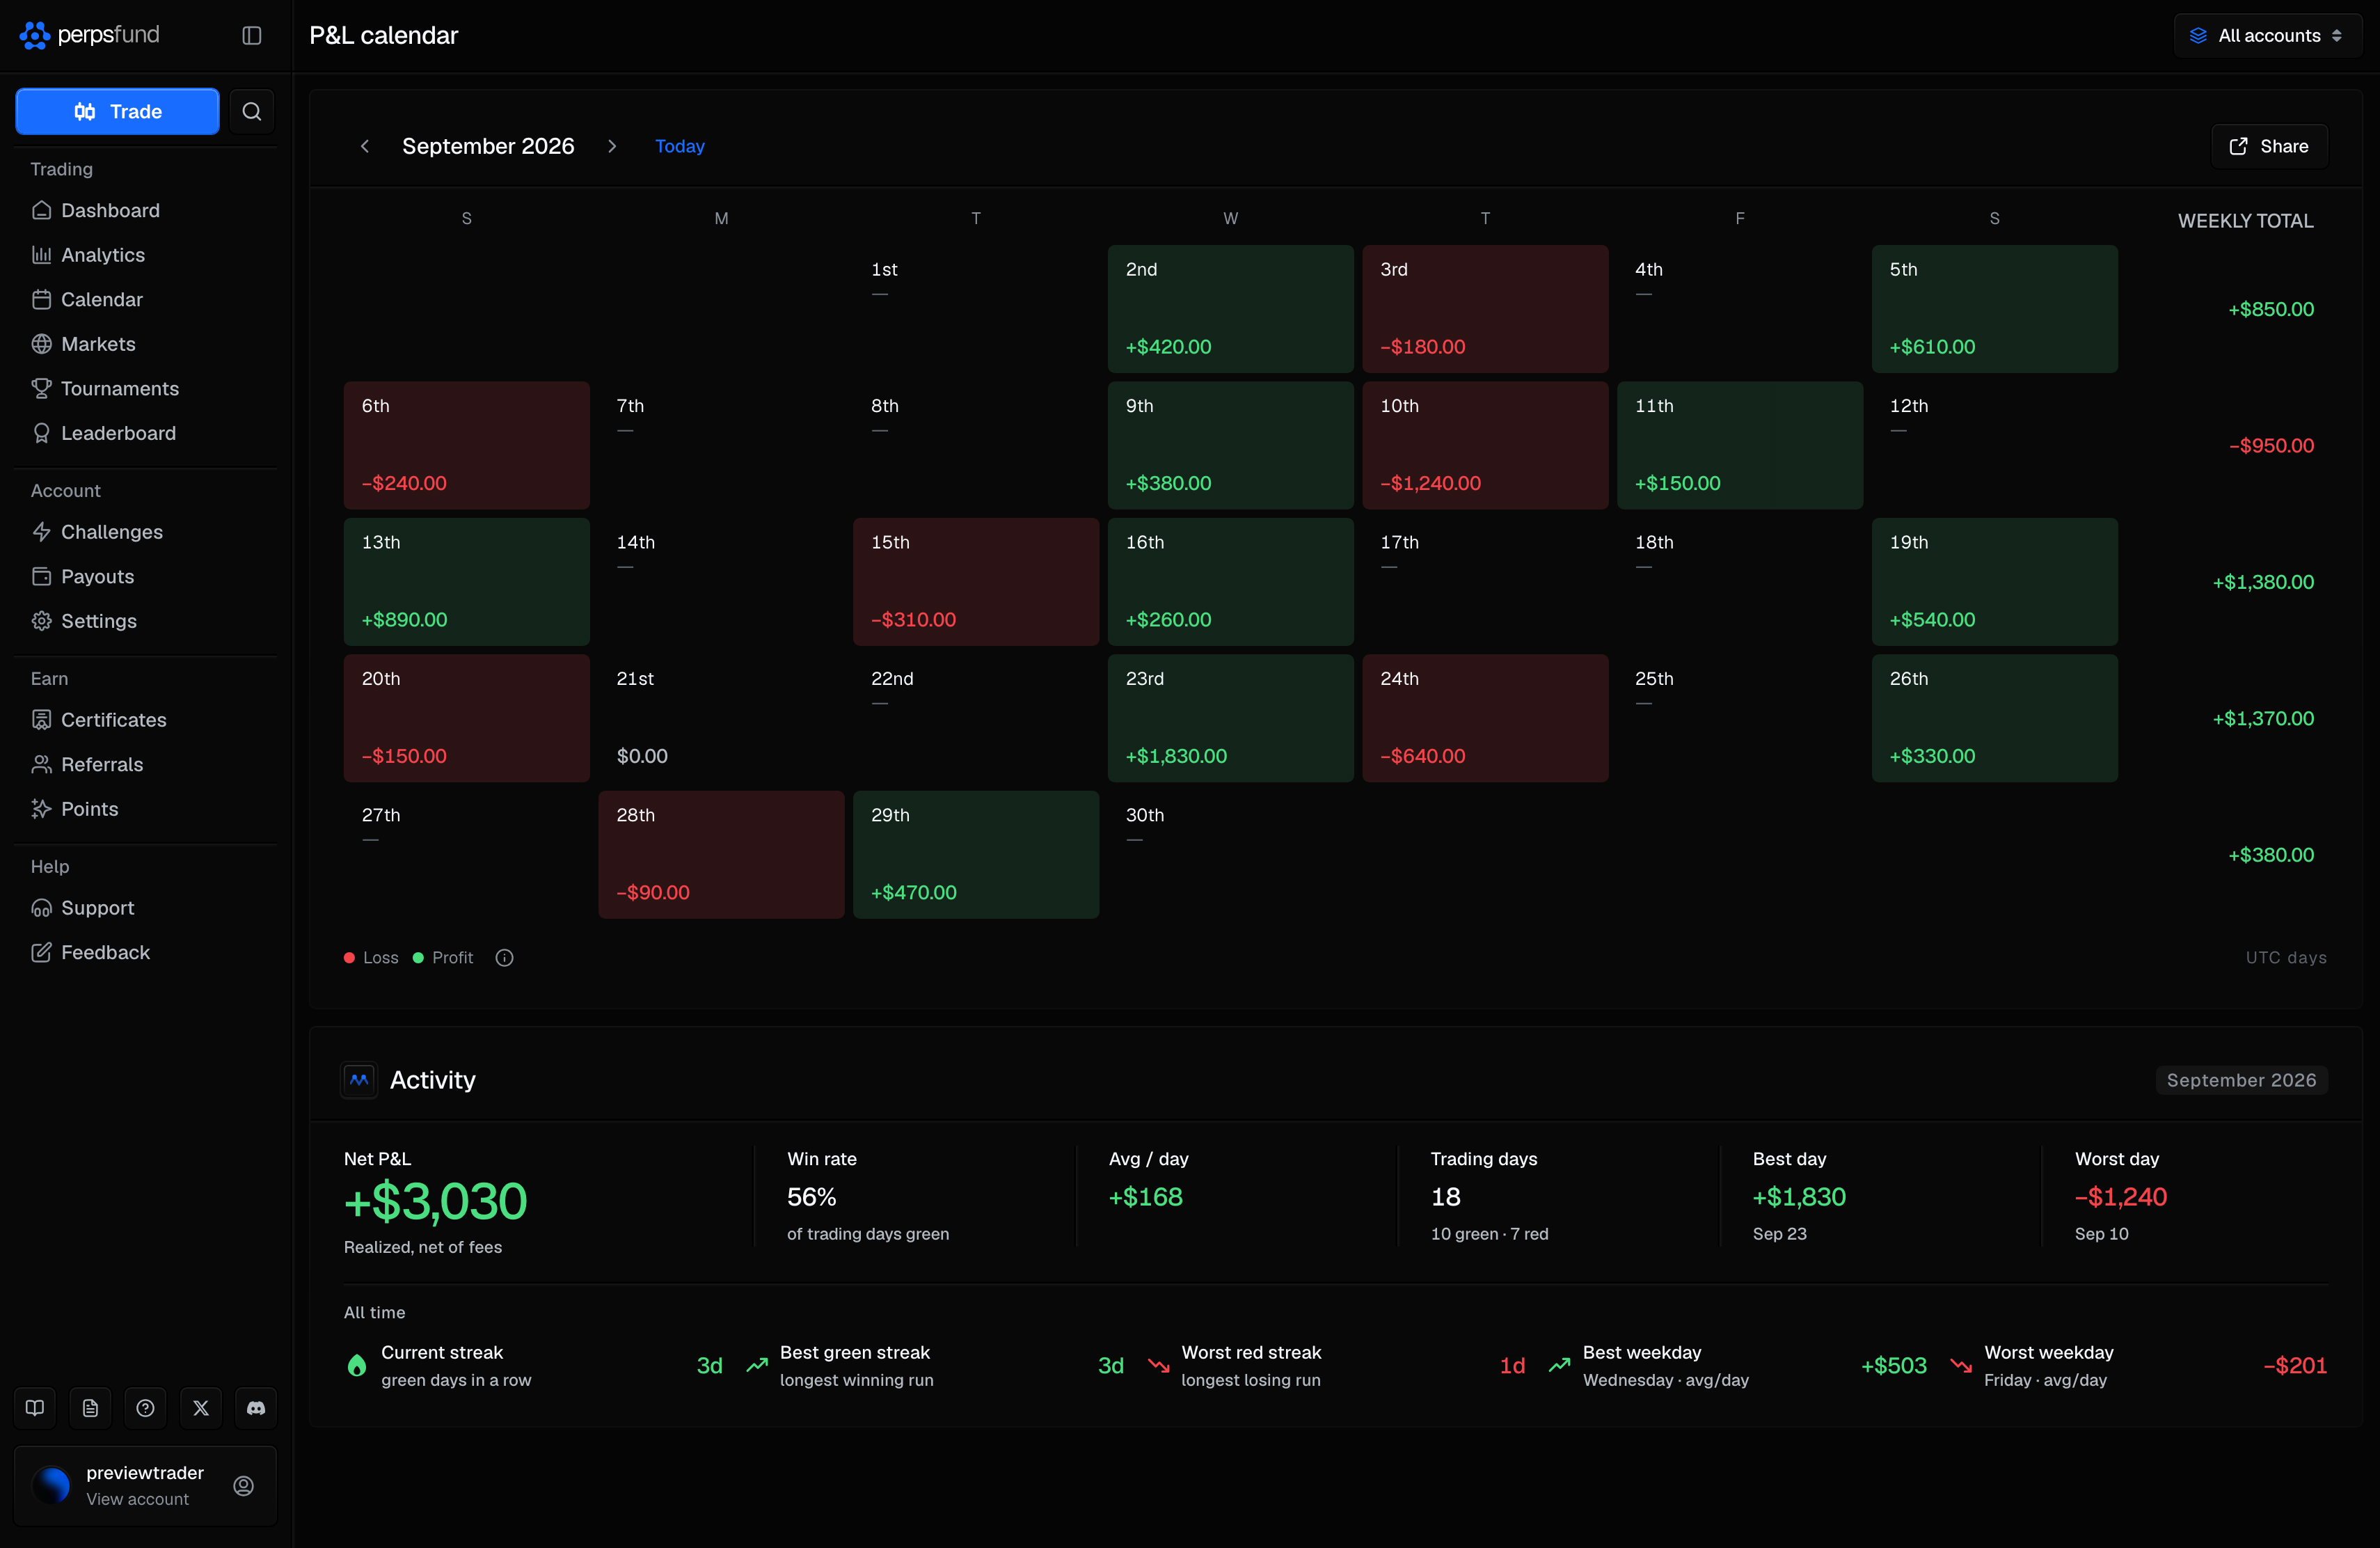
The Calendar shows your closed trades arranged by the day they closed: a month grid where each day carries that day's P&L, with the month's numbers and the streaks and weekday records from your whole history below it. The page is titled P&L calendar; in the navigation it is Calendar.
It opens on All accounts, which puts every account's trades into one view. If you hold more than one account, the account switcher in the header narrows it to a single account.
When you'd use it
- To see whether a bad run is a pattern or a day. The grid makes a single red day look like what it is, next to the month around it.
- To find your own weekday tendencies before they cost you a target.
- To check a streak. Your current run is shown live, alongside your best green and worst red runs.
What's on the page
| Area | What it shows |
|---|---|
| Month grid | One cell per day with that day's P&L, green for profit and red for a loss, and a Weekly total column on desktop. On a phone the date sits in the cell's top-left corner and the figure in its middle. The arrows move between months and Today jumps back to the current one. Select a day with a gain or loss for its detail: its P&L, trades closed, wins and losses, and the list of trades closed that day. |
| Activity | Below the grid, for the month shown. It leads with the month's Net P&L ("Realized, net of fees"), then five month stats: Win rate (the share of trading days that were green), Avg / day, Trading days (green and red), Best day and Worst day. On a computer these sit on one line. |
| All time | The last group in the Activity section, under its own All time label, drawn from your whole history rather than the month: Current streak, Best green streak, Worst red streak, Best weekday and Worst weekday (by average P&L per day). On a computer these sit on a second line. |
What counts
Only closed trades appear. A day's figure is the realized P&L of the trades closed that day, minus their fees. Days are UTC days. An open position contributes nothing to the grid until you close it, however far in profit it is.
Sharing your month
Share opens the calendar card for the month on screen and the accounts selected. On a computer it sits at the right end of the month's row, above the grid; on a phone it is the share button in the page's header. Unlike most PnL cards, it prints dollars: each day's P&L and number of markets, the weekly totals, the month total and your all-time total, with your @handle. Share is disabled for a month with no closed trades.
Archived accounts still count
Archiving an account hides it from the switcher's lists, but its trades still feed the All accounts view and every figure on this page. Archiving is a view preference, never a data filter, so your history does not quietly change shape when you tidy up. Which accounts can be archived is on the Dashboard page.
The Dashboard's month
The Dashboard's Performance panel is a small version of this grid for the selected account: the current month's days, its net result, and its win and loss days. This page adds the other accounts, the all-time records, the day detail and the share card.
Per trade
For the per-trade view rather than the per-day one, use Trade History on Analytics, which lists every closed trade and exports them. The Dashboard's Recent Activity shows only the latest trades.