Terminal
The trading screen, part by part: the top bar, the market header, the chart and its tabs, two charts side by side, the order column and its Account section, the console, settings, shortcuts, and the phone terminal.
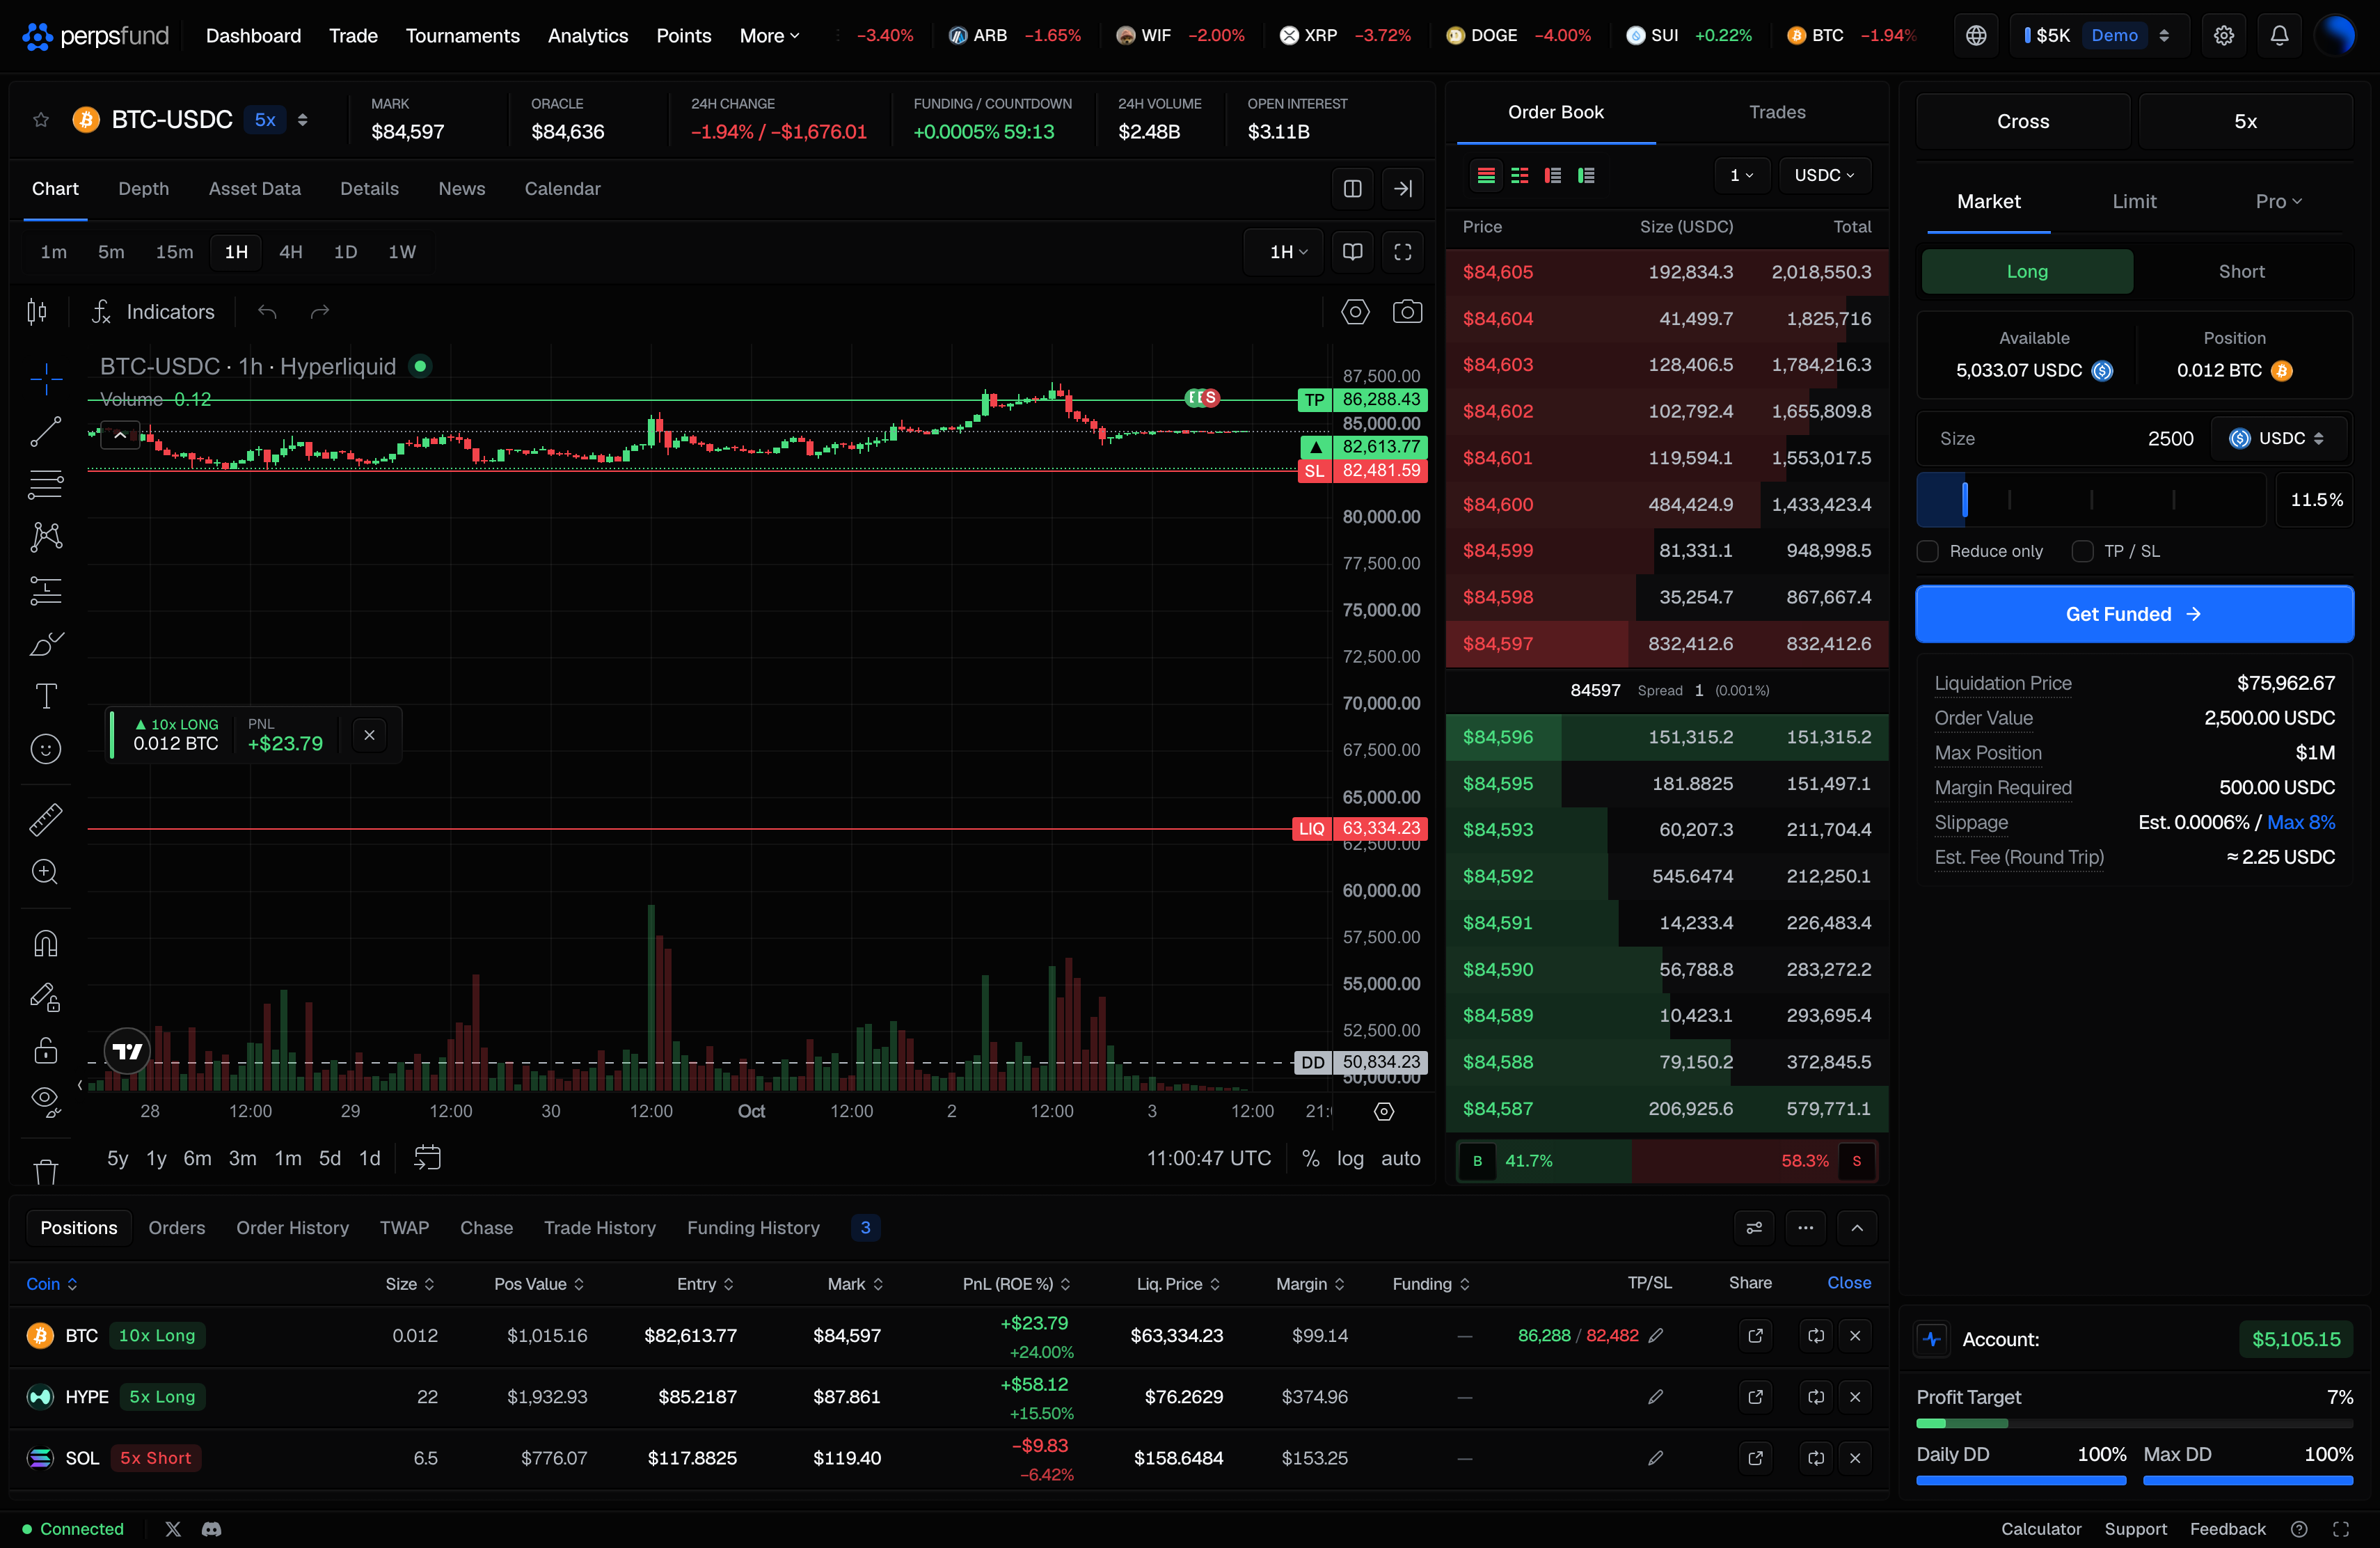
The terminal is where you trade. Orders are placed on a simulated account priced on live Hyperliquid prices. On a desktop screen the chart sits in the center, the order book beside it, the order ticket and your account figures on the right, and your positions and orders in the console along the bottom.
This page explains what each part shows and does. How to build and place an order is on Placing an order, the advanced order types are on Pro order types, and the limits themselves are in the Rules and Trading rules.
Look around before you buy
Open /trade signed out to see the terminal with live prices, the chart and the order book. It does not place orders: in place of the order button it shows Get Funded, which opens a prompt to claim a free trial account. On a computer, signing up from that prompt happens in a window over the terminal, and once you are in, the claim opens right there. On a phone the prompt opens the sign-up page, and once you are in you are back on the terminal with the claim open. If the trial is paused, the claim says so instead of offering it. Signed in, the same link opens your account (the one you used last); with no account yet, Get Funded takes you to the challenges.
The top bar
The bar across the top holds navigation and the market ticker. It carries no account figures: those are in the Account section of the order column.
| Element | What it does |
|---|---|
| Nav | Dashboard, Trade, Tournaments, Analytics and Points. Signed out, in the demo terminal, Tournaments opens the public Tournaments list; signed in it opens your standings. Trade is the terminal you are on. Dashboard, Analytics and Points ask you to sign in, because they show your own account. |
| More | Referrals, Leaderboard, Discord, X / Twitter, Trading rules, Docs, Help & FAQ, Terms of use and Privacy policy. Every one of them opens in this tab except Discord and X / Twitter, which leave for those sites. Docs opens the docs site. Referrals is about your own account, so signed out it asks you to sign in; Leaderboard is public. |
| Market ticker | A scrolling line of prices and 24h change. |
| Source button | Beside the ticker. It switches the ticker between Hyperliquid (crypto perpetuals, the default) and TradFi (stocks, indices and commodities). The market choice is not saved: the ticker starts on Hyperliquid each time the page loads. Its third option, Hide, removes the ticker from the bar and is saved in this browser with your trading settings; pick a market again to bring it back. The bar keeps its height, so the chart does not grow. |
| Account chip | Shows the account you are on, tagged with a short upright line in its badge's colour, and opens the switcher for your other accounts. |
| Settings | The gear, between the account chip and the bell. It opens Trading Settings (below). |
| Bell and profile | Your notifications, and a menu with Public Profile, Feedback, Payouts, Settings and Sign out. The notification panel drops below the bell, lined up with its right edge: the same panel, in the same place, as on the Dashboard. Signed out, a Sign in button takes their place. On a computer it opens a sign-in window over the terminal, the same form as the sign-up page with both tabs, Google and passkeys, and brings you back to the terminal once you are in; on a phone it opens the sign-in page. |
The market header
Above the chart, the market header names the market you are trading (click it, or press Cmd/Ctrl + /, to
pick another) and shows its price, Mark, Oracle, 24h Change, Funding / Countdown,
24h Volume and Open Interest. Hover a label for what it means. On a computer the market search window
lists every market with its last price, 24h change, funding, volume, open interest and Cap: the largest
position the firm allows in that market, shortened (for example $250K), the same figure the order panel shows
as Max Position. A market whose open interest has not loaded yet shows the smallest cap until it does.
For stocks and indices a session badge shows whether the underlying US market is in its regular session: Market Open, Pre-Market, After Hours or Market Closed. It follows regular US trading hours in New York time and does not know about market holidays. The badge describes the underlying exchange, not the perpetual you trade. You can hide it in Terminal settings.
The chart
The chart is TradingView Advanced Charts. It has TradingView's drawing tools down the left, and chart types, indicators, undo and redo, chart settings and a snapshot (camera) button along the top.
-
Snapshot. The camera at the right end of the chart's top toolbar opens two choices: Download image saves the chart as a PNG, and Copy image puts it on your clipboard. Both happen in your browser; the image is not uploaded anywhere.
-
Saved per market. Your drawings, indicators and chart layout are saved for each market separately and come back when you return to it. Signed in, they are saved to your account and follow you to another device. On the signed-out terminal they are saved in this browser only.
-
Intervals. 12 intervals: 1m, 3m, 5m, 15m, 30m, 1H, 2H, 4H, 8H, 12H, 1D, and 1W, in the interval menu with the common ones as quick picks.
Cmd/Ctrl+1to5switch to 1m, 5m, 15m, 1H, and 4H. The interval you are on is the one quick pick drawn as a pill in the notification bell's look: its dark fill and its quieter top edge, with no line along the bottom. Every tab row and segmented switch across the platform now marks its selected option the same way. The pill has not moved or changed size. The phone marks the selected interval the same way, both in the strip beside the chart and in the Chart interval sheet. -
Your trades on the chart. Lines mark your entry, take-profit, stop-loss and breach price, and markers show your buys and sells. Each can be turned off in Terminal settings. On a computer you can drag the take-profit and stop-loss lines to change them; see Take-profit and stop-loss.
-
The price scale. While you hold a position on the market, the chart widens its price scale so your breach price and the account's loss lines are in view. If you drag or pinch the scale yourself, it stays where you put it, even if that leaves one of those lines off the chart. Press auto under the price scale to bring them back. A new position on the market, or switching market, also brings them back.
-
Fullscreen. The fullscreen button in the band above the chart fills the window with the chart column. The one in the status bar at the very bottom puts the whole terminal in full screen.
The chart column tabs
The tabs above the chart switch what the center column shows.
| Tab | What it shows | Follows the selected market |
|---|---|---|
| Chart | The TradingView chart. | Yes |
| Depth | The order book drawn as a depth chart. | Yes |
| Asset Data | Open interest: the total value of open positions on Hyperliquid, with its recent change. Trader positioning: the long and short split of Perps Fund traders in this market (not the venue as a whole), by trader count and by notional. It is shown once enough traders hold the market. | Yes |
| Details | Reference information about the market and what it tracks. | Yes |
| News | Market-wide headlines. Each opens the story on the publisher's site. | No |
| Calendar | The schedule of upcoming US economic releases, tagged by expected impact. | No |
When the chart column is narrow (for example a 1024 px window with the order book open), the tabs sit a little closer together so all six stay visible beside the buttons on the right.
The tab row also holds the two-charts button and the order book toggle. The row of intervals under it, above the chart, holds Rules (opens Challenge Rules, the targets and loss limits for the account) and the chart fullscreen button.
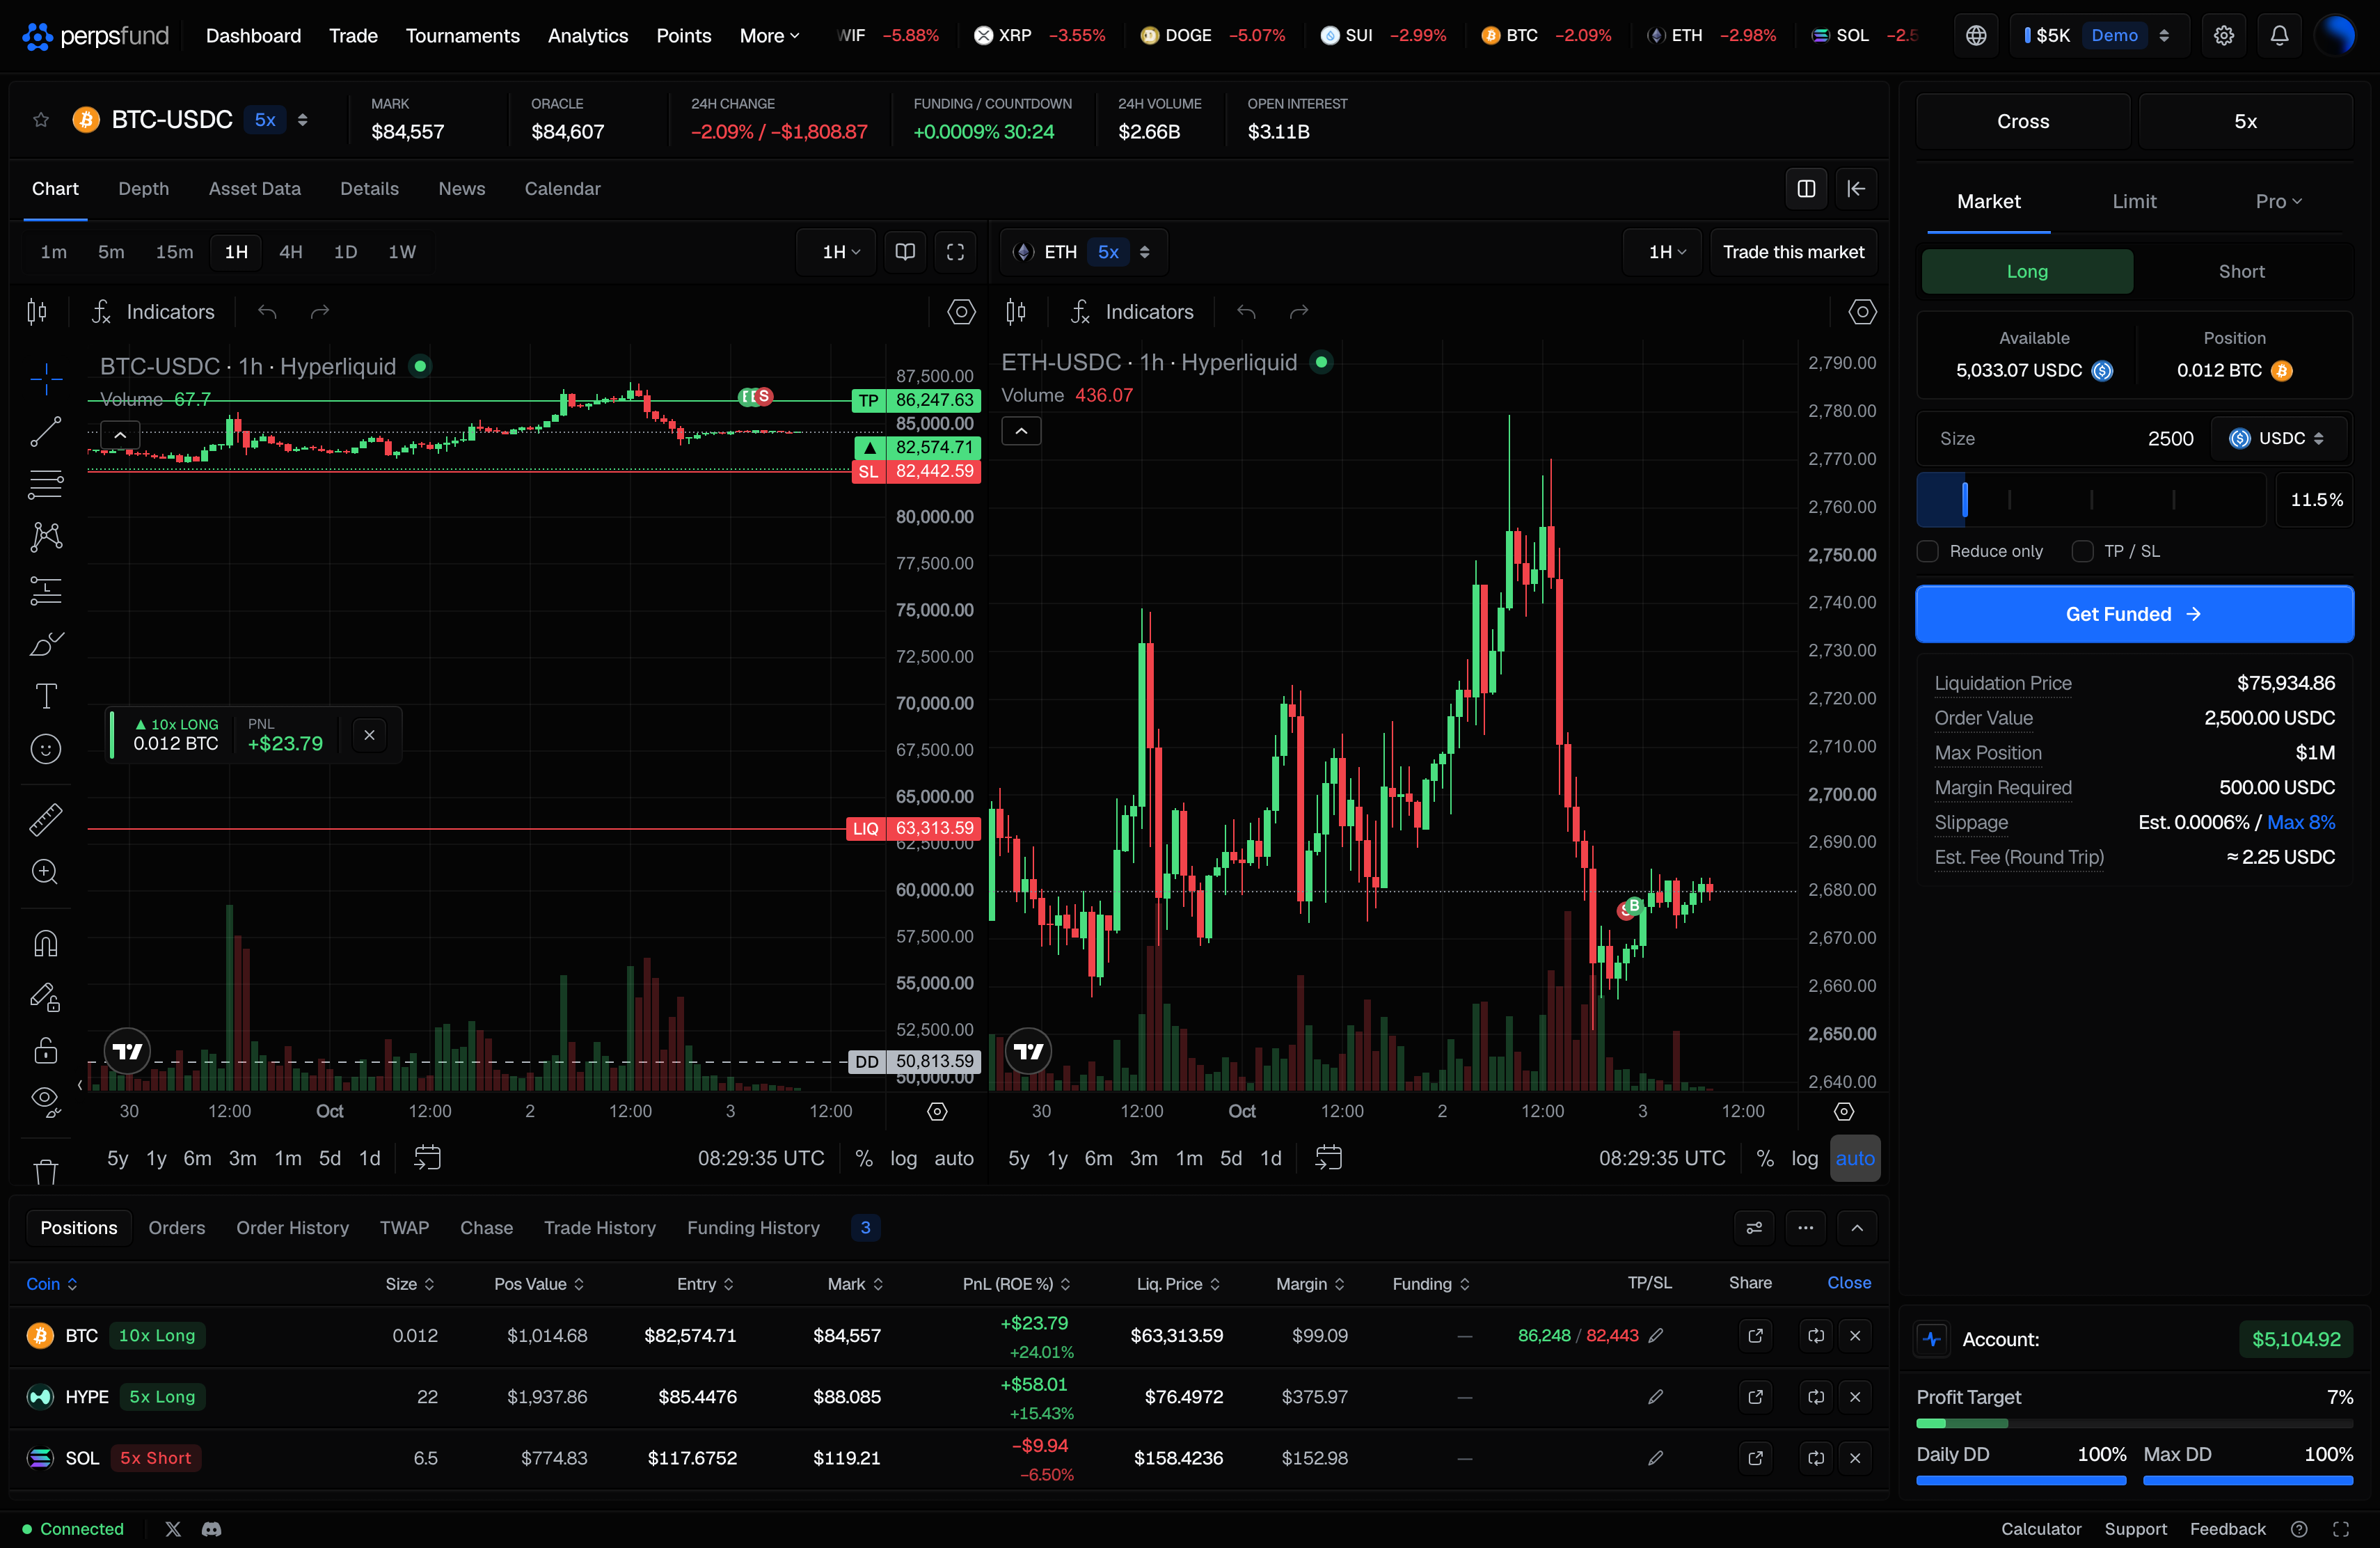
Two charts side by side
On a wide desktop window you can show a second chart beside the first. The Two charts button in the chart band is offered once the chart panel is at least 961px wide; below that it is disabled with the tooltip Needs a wider window. Collapsing the order book gives the chart that room on many screens. If the panel narrows again (for example you open the order book), the second chart hides, and it comes back when there is room.
- The right chart is for watching. It has its own market (pick it from the button at its top left) and its own interval. It shows your position and order lines for its market and any drawings you saved on that market, but it has no drawing tools and saves nothing.
- Its market button shows the maximum leverage for that market beside its name, the same badge the market header shows beside the left chart's market.
- Its intervals. On the widest windows the right chart shows the quick-pick intervals beside its market; on narrower ones it shows only the interval menu, which still lists all 12.
- The ticket stays on the left chart's market. To trade the market on the right chart, press Trade this market: the ticket and the left chart switch to it.
- If both charts show the same market, the right one reads Read-only drawings: the left chart saves drawings and the right one only shows them.
- Whether the split is on, and the right chart's market and interval, are saved in this browser, not your account.
Two charts are not offered on the phone.
The order book and trades
Beside the chart, the order book column has two tabs: Order Book (live bids and asks, with price grouping) and Trades (the recent trades feed). Above the book, four icons choose its layout, and two buttons set the price step the book is grouped at and whether the Size and Total columns are in USDC or in the coin. When the two do not fit on one line (a market priced to five or six decimals, or a narrow window), they become one button showing the step; its menu has two parts, Step and Sizes in. The toggle in the chart band hides the column (Hide order book) and brings it back (Show order book); the choice is saved in this browser.
The order panel
The right column is the order ticket: the Cross margin mode and the leverage control, the order type (Market, Limit or Pro), Long or Short, the price for a limit order, the size and its slider, the Reduce only and TP / SL checkboxes (a Pro form shows Reduce only alone), and a cost card that ends in Est. Fee (Round Trip), the fee to open plus a taker fee to close, estimated at today's price. On a market order the card also carries a Slippage row (Est. 0.0122% / Max 8%): the estimated slippage for your size on the live order book, and the most you will accept. A market order whose estimate is above your max is rejected whole; see Max slippage. Every control and figure is explained on Placing an order. The Pro menu adds seven order types, described on Pro order types.
The Account section
Below the ticket, the Account: section shows your live equity and the figures you trade against.
The equity figure sits in a coloured badge: green while the account is above the balance it started with,
red while it is below, and grey while the two are level. The comparison is against your starting
balance - the funded size on a funded account, $5K on a free trial - not against yesterday, and not against
the profit target. Level means level to the cent: a difference smaller than half a cent still reads grey, so a
still account does not flicker green between price ticks. With Hide P&L values on, the figure reads ****
in the grey badge, because a colour would say which way you are while the numbers are hidden.
| Row | What it shows | Shown by default |
|---|---|---|
| Account: (equity) | Balance plus the open profit or loss on your positions, in a badge coloured by direction. Your loss floors are measured against this. | Always |
| Profit Target | Your progress to the phase target, as a whole percentage: 0% at the start, 100% at the target. It counts closed profit only, which is what the target counts. On the bar, the solid part is that closed profit and the dimmer part is profit on open positions. Hover the label for how the pass is counted on your account. Not shown on a funded account or a tournament account, which have no target. | Always |
| Profit (funded accounts) | Your share of the profit on a funded account, in place of Profit Target. | Always |
| Rank (tournament accounts) | Your place in the tournament, for example #17, in place of Profit Target. It reads Unranked until you close your first trade in the window, and Disqualified (or Under review) if your entry was. Click the figure to see when the rank was last calculated: "as of 14:15 UTC · updates every 15 minutes". It is the same rank the dashboard shows. | Always |
| Daily DD | How much of today's loss allowance is left, as a whole percentage, with its own bar. It is 100% at the start of the day and 0% when your equity touches the daily loss floor. It resets each day. On an account with no daily limit it reads No limit and has no bar. | Yes |
| Max DD | How much of your total loss allowance is left, as a whole percentage, with its own bar. It never reads more than 100%: on an account in profit the allowance is still whole, so it reads 100% with a full bar, as the dashboard does. At 0% the account has breached. On an account with no overall limit it reads No limit and has no bar. | Yes |
| Margin Ratio | How much of your equity is tied up as margin. It is not the breach trigger. | No |
Daily DD and Max DD sit side by side on one line, the same row the phone Dashboard shows. Both are measured on equity, so an open loss counts against them before you close. Each bar turns red below 20%. The three optional rows are switched in Terminal settings. How each floor is measured is in Equity-based limits.
Leverage and margin
Leverage is capped per market at the lower of the firm's cap and Hyperliquid's own maximum; the leverage control shows the cap for the market you are on, named by its symbol (for example Max 5x for BTC). The firm caps by tier:
| Asset tier | Max leverage |
|---|---|
| Majors - BTC, ETH | 5x |
| Stocks, indices, commodities, FX | 4x |
| Other crypto | 2x |
The margin mode is Cross, and it is the only mode: the account breaches on its total equity against the loss floor, whichever position caused it. Details are on Placing an order and in Position sizing and leverage.
Position sizing
A position can be worth up to equity × leverage, the margin across your positions cannot exceed your equity, and the minimum order is $10. Each market also has its own absolute cap on position size, shown in the ticket as Max Position; the tighter of the two binds. The full table of per-market caps is on Placing an order.
Fees
Fees are charged on notional: taker 0.045% to open with a market order and on every close, maker 0.015% to open with a limit order that fills. Pro order types have their own fee list, and the authoritative schedule is in Fees.
Positions and history
The console along the bottom has seven tabs.
| Tab | What it shows |
|---|---|
| Positions | Your open positions. |
| Orders | Resting limit orders, plus running Scale, Swarm and Conditional orders with their progress and a stop control. |
| Order History | Your resting orders (status Open) and your filled trades (status Filled). |
| TWAP | Running and finished TWAP orders, and their fills. |
| Chase | Running and finished Chase and Chase TWAP orders. |
| Trade History | Closed trades, with realized profit or loss. |
| Funding History | Funding paid or received on open positions. |
Sorting (computer). Every column you can order by has a small up-and-down arrow beside its heading, grey until you use it. Click the heading once to sort (A to Z for names and sides, biggest or newest first for numbers and times), click again to reverse it, and a third time to go back to the order the rows came in. The top arrow turns blue when the column sorts up, the bottom arrow when it sorts down. Every tab has it. The Positions and Trade History sort is remembered in this browser and is shared with the phone's sort button; the other tabs start unsorted each visit. On a phone the sort button also orders Orders (by date, size, price or symbol); that choice is remembered too. The market search window's columns sort the same way.
The Positions columns (Orders, Order History and Trade History keep a separate Side column):
| Column | What it shows |
|---|---|
| Coin | The market, with a badge beside it for the side and the leverage, for example 5x Long or 2x Short. |
| Size | The position size in the asset. |
| Pos Value | The position's value in dollars. |
| Entry | Your average entry price. |
| Mark | The current mark price, at that market's own price step. |
| PnL (ROE %) | Open profit or loss, and the return on the position's margin. |
| Liq. Price | The breach price for this position (see below). |
| Margin | The margin the position uses. Shown on screens 1395 px wide or wider; below that the column is hidden to save room, like Funding. |
| Funding | Funding paid or received on this position. Shown on screens 1395 px wide or wider; below that the column is hidden to save room. The Funding History tab lists every payment at any width. |
| TP/SL | The take-profit and stop-loss levels, at that market's own price step whatever market the chart is on. The pencil opens Adjust TP/SL. |
| Share | The share icon. Opens a PnL card for the position. |
| Close | The heading is itself a button (see below). Each row has two buttons under it. The looped arrows open Reverse Position (see below). The × beside them opens the close dialog; point at it for Close position. Nothing closes or reverses until you confirm. |
Close all and reverse
The ⋯ button to the right of the filter, on the Positions tab, opens the actions menu. It is always available, with no positions too. Each row shows how many positions it covers; a row at 0 is greyed out.
| Row | What it does |
|---|---|
| Close All | Opens the review window with every open position, to close them at market. |
| Close All Longs / Close All Shorts | Opens the review window with your longs, or your shorts, to close them at market. |
| Reverse All | Opens the review window with every open position, to reverse them. |
| Reverse Longs / Reverse Shorts | Opens the review window with your longs, or your shorts, to reverse them. |
The review window. Every row opens it on one click, and nothing closes, reverses or cancels until you confirm there. Its title is the action, for example Close All Longs or Reverse Shorts. It lists every position the action covers, each one ticked. For a close, a row shows the side and size, the value at the current price, the realized profit or loss and the estimated fee. Under the list a total line adds up the ticked rows: realized profit or loss, estimated fees, and the net of the two. Untick any position you want to leave alone. The button at the bottom names the action and the count, for example Close 3 positions, and is greyed out when nothing is ticked. Press Esc or the × to close the window with nothing done. Afterwards a message says how many positions closed, the realized profit or loss and the fees, and names any position that could not be closed.
Close in the table heading. The last column's heading on the Positions tab is a blue Close; point at it for Close all positions. It does what the menu's Close All does, without opening the menu: one click opens the same review window with every open position. With no open positions it is greyed out and does not open.
Reversing a position. A reverse closes the position at market and then opens the opposite side at the same size and leverage: a 0.012 BTC long becomes a 0.012 BTC short. It is two orders, so it pays two taker fees. A take-profit or stop-loss on the position goes with the close and is not carried to the new one. The reverse window lists each position with its current side, the new side, the realized profit or loss of the close and the estimated fees for both orders, with a total underneath. Untick any position you want to leave alone, then press the button at the bottom, which reads for example Reverse 2 positions. The reverse button on a position's own row opens the same window with that one position.
The new order passes the same checks as any order, after the close. If it is refused, for example because the close took you to a loss limit or the new position would be over a cap, the position stays closed and nothing is retried; the message says which position was left flat and why. When the terminal can already tell a reverse would be refused, the row's reverse button is greyed out and pointing at it says why, and the position is listed unticked in the reverse window. One case to know: if closing your last position takes your closed balance to the profit target, the close completes the challenge, so there is nothing to reverse into.
Breach price and liquidation
There is one liquidation on an evaluation account: your account breach. The terminal shows it on each position as a price: the price at which that position's loss would pull your account equity down to its loss floor. It is not a separate per-trade liquidation.
The breach price is indicative
The breach price moves with the market and with your other open positions, so treat it as a live guide, not a fixed guarantee. How a breach is measured is defined in Equity-based limits and Breach and liquidation.
The calculator. Calculator in the status bar at the bottom of the desktop terminal opens a calculator with three modes: PnL, Target Price and Liq. Price. Its leverage starts at the selected market's cap. The liquidation price it computes is the same account breach price, so changing leverage changes the margin and the return, not the liquidation price.
Closing and sharing
The × (Close position) on a position, or on the profit-and-loss box on the chart, opens a dialog titled with the market (for example Close BTC-PERP). Choose Market or Limit, set the Close Amount as a percentage for a partial close, and confirm. A limit close rests until the market reaches your price; every close pays the taker fee.
Share opens a PnL card. It shows percentages by default; the Show $ amount switch adds the dollar profit or loss.
Terminal settings
Settings (the gear in the top bar, between the account chip and the bell) opens Trading Settings, with three tabs. The settings are saved in this browser, not your account, so another device starts from the defaults.
| Tab | Settings |
|---|---|
| Display | Hide PNL values · Hide $ on position P&L (show %) · Show buy/sell markers on chart · Show candlestick tooltip · Show liquidation & breach lines · Show Max DD (global cushion) · Show Daily DD · Show Margin Ratio · Show market session badge (TradFi) · Show PnL box on chart |
| Orders | Skip cancel order confirmation · Persist size after order · Persist % of available margin · Interface sounds |
| Shortcuts | The keyboard shortcuts below. |
Interface sounds is off by default. When on, it plays a soft tone when a resting limit order fills or a take-profit or stop-loss you set triggers. With Skip cancel order confirmation off, the first press of Cancel, Stop or Terminate arms the button (Confirm?) and the second press acts.
Keyboard shortcuts
These work when you are not typing in a field. Cmd on a Mac, Ctrl elsewhere.
| Shortcut | Action |
|---|---|
Cmd/Ctrl + / | Open the market selector |
Cmd/Ctrl + B | Switch to Long |
Cmd/Ctrl + S | Switch to Short |
Cmd/Ctrl + L | Open the leverage dialog |
Cmd/Ctrl + 1 to 5 | Chart interval: 1m, 5m, 15m, 1H, and 4H |
Cmd/Ctrl + H | Hide or show P&L values |
Cmd/Ctrl + K | Open the platform search (signed in) |
Esc | Close the open panel or dialog |
Fills use a fresh price
A market order fills against a price no more than 2 seconds old, and a fill more than 0.5% away from the price you saw is refused rather than filled at a worse level. A market order that opens or adds to a position is also refused when its estimated slippage is above your max slippage; closing is never limited by it. How orders execute is covered in Markets and execution.
On your phone
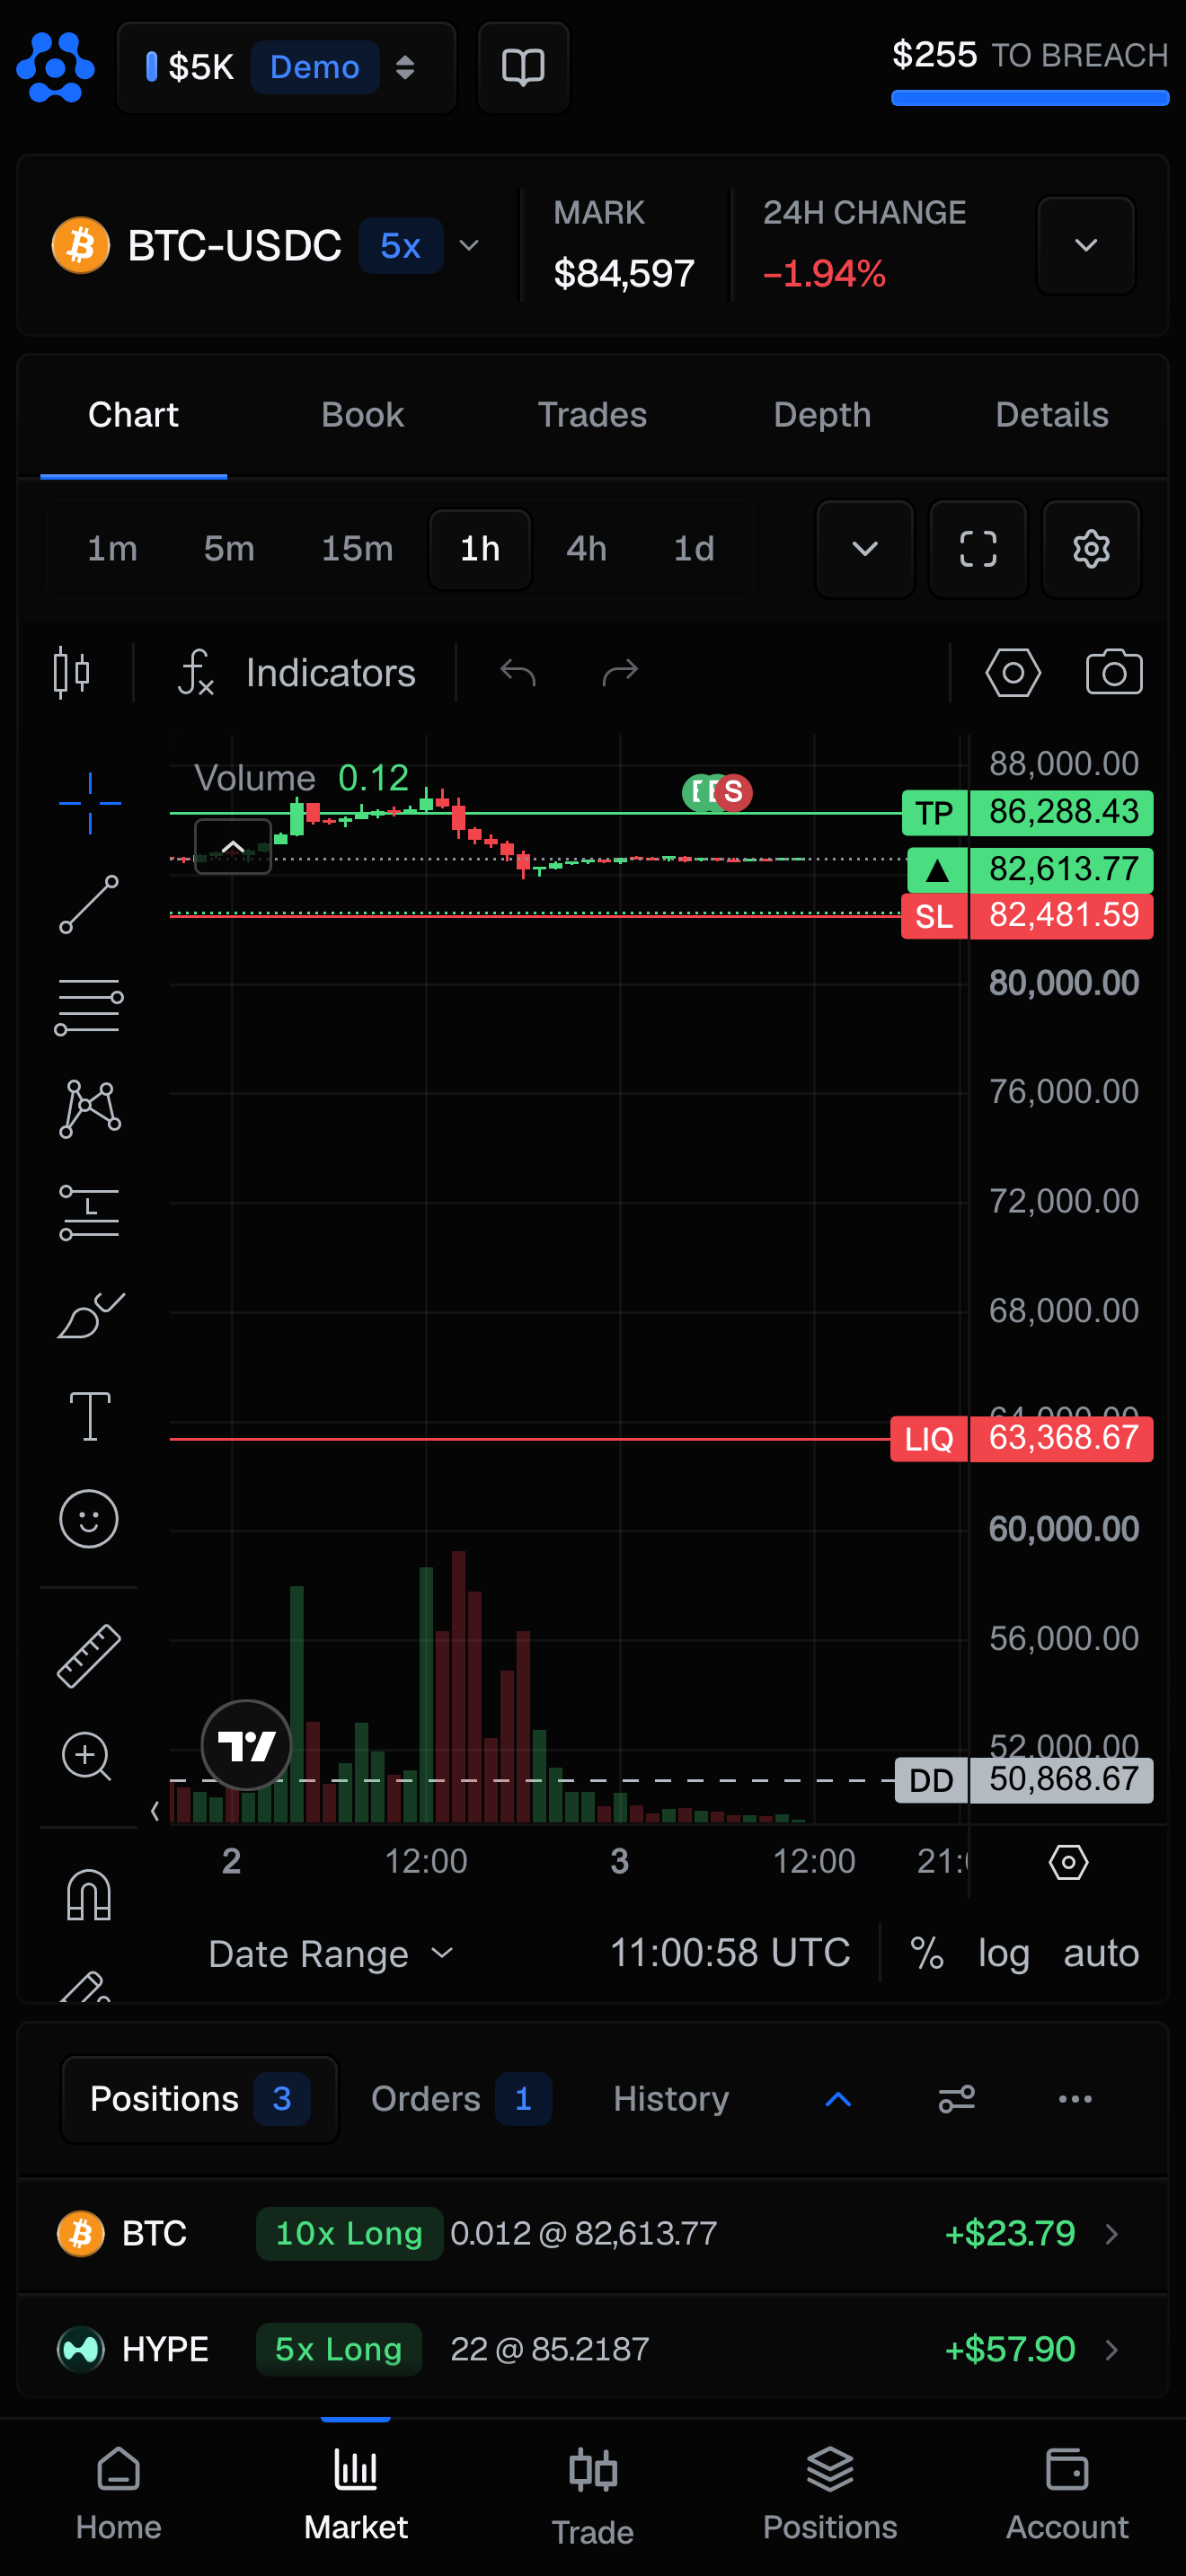
On a phone the terminal is laid out for one hand, with a tab bar along the bottom:
| Tab | What it holds |
|---|---|
| Market | The market header and a pane with Chart, Book, Trades, Depth and Details. The chart is TradingView here too. |
| Trade | The order ticket, with Market, Limit and the Pro menu (it opens as a sheet). Placing an order opens Review order to confirm. |
| Positions | Positions, Orders and History. Running Pro orders sit at the top of Orders with their progress, and can be cancelled there. |
| Account | Your equity, Closed balance and Unrealized P&L, a Margin headroom gauge with the ratio, margin used and maintenance beside it, and the Daily floor cushion and Max drawdown cushion. Support and Feedback at the foot. |
The arrow beside the price in the market header opens the market's stats: Funding / Countdown, 24h Volume, Open Interest and Max position. Each name has a dotted underline; tap it for what the figure means.
The sort button and the ⋯ button at the right of the strip stay in place on all three tabs. On Positions the ⋯ button opens the same actions as a sheet (Close All, Close All Longs, Close All Shorts, Reverse All, Reverse Longs, Reverse Shorts). On Orders it opens Cancel All, Cancel Longs and Cancel Shorts, each with its count of resting orders; a row at 0 is greyed out. One tap opens the review window, titled for example Cancel All Orders, listing each order's side, size and price, every one ticked, with the orders' total value underneath. Its button reads for example Cancel 3 orders; one message afterwards says how many were cancelled and names any that were not. A running Pro order is not a resting order and is cancelled from its own row. On History the sheet reads No actions on history. A position's own sheet has a Reverse button above Share P&L.
Tapping a position points the chart at that market. The phone has no Asset Data, News or Calendar tab, no calculator, no second chart and no keyboard shortcuts.
The Account tab names its figures on the figures themselves rather than in headings above them, so every label there is the name of the number beside it. The Positions tab opens on Open P&L, the same unrealized figure the Account tab shows, with the number of open positions, their notional and the margin they use under it.
Related
- Placing an order - the ticket, fills, caps, fees and TP/SL.
- Pro order types - Scale, TWAP, Swarm, Conditional, Chase and Chase TWAP.
- Platform search -
Cmd/Ctrl+Kfrom any signed-in page. - The Rules - the authoritative limits, leverage, fees, and how a breach is measured.
- The Dashboard - track your equity and cushion across accounts.