Dashboard
Your account home, one account at a time: live equity, the profit-target or payout line, your loss-limit cushions, your Perps Score, open positions, the equity curve, this month's days, and your latest closed trades. Before your first account it is the same page at zero, with two ways to get one.
The Dashboard is your account home. It shows one account at a time: its live equity, how far it is from its profit target (or, once funded, what you can be paid from it), how much room it has before a breach, its open positions, its equity curve, this month's trading days, and its latest closed trades.
It is your private view, so every figure on it is in dollars. What you share from it is covered on PnL cards.
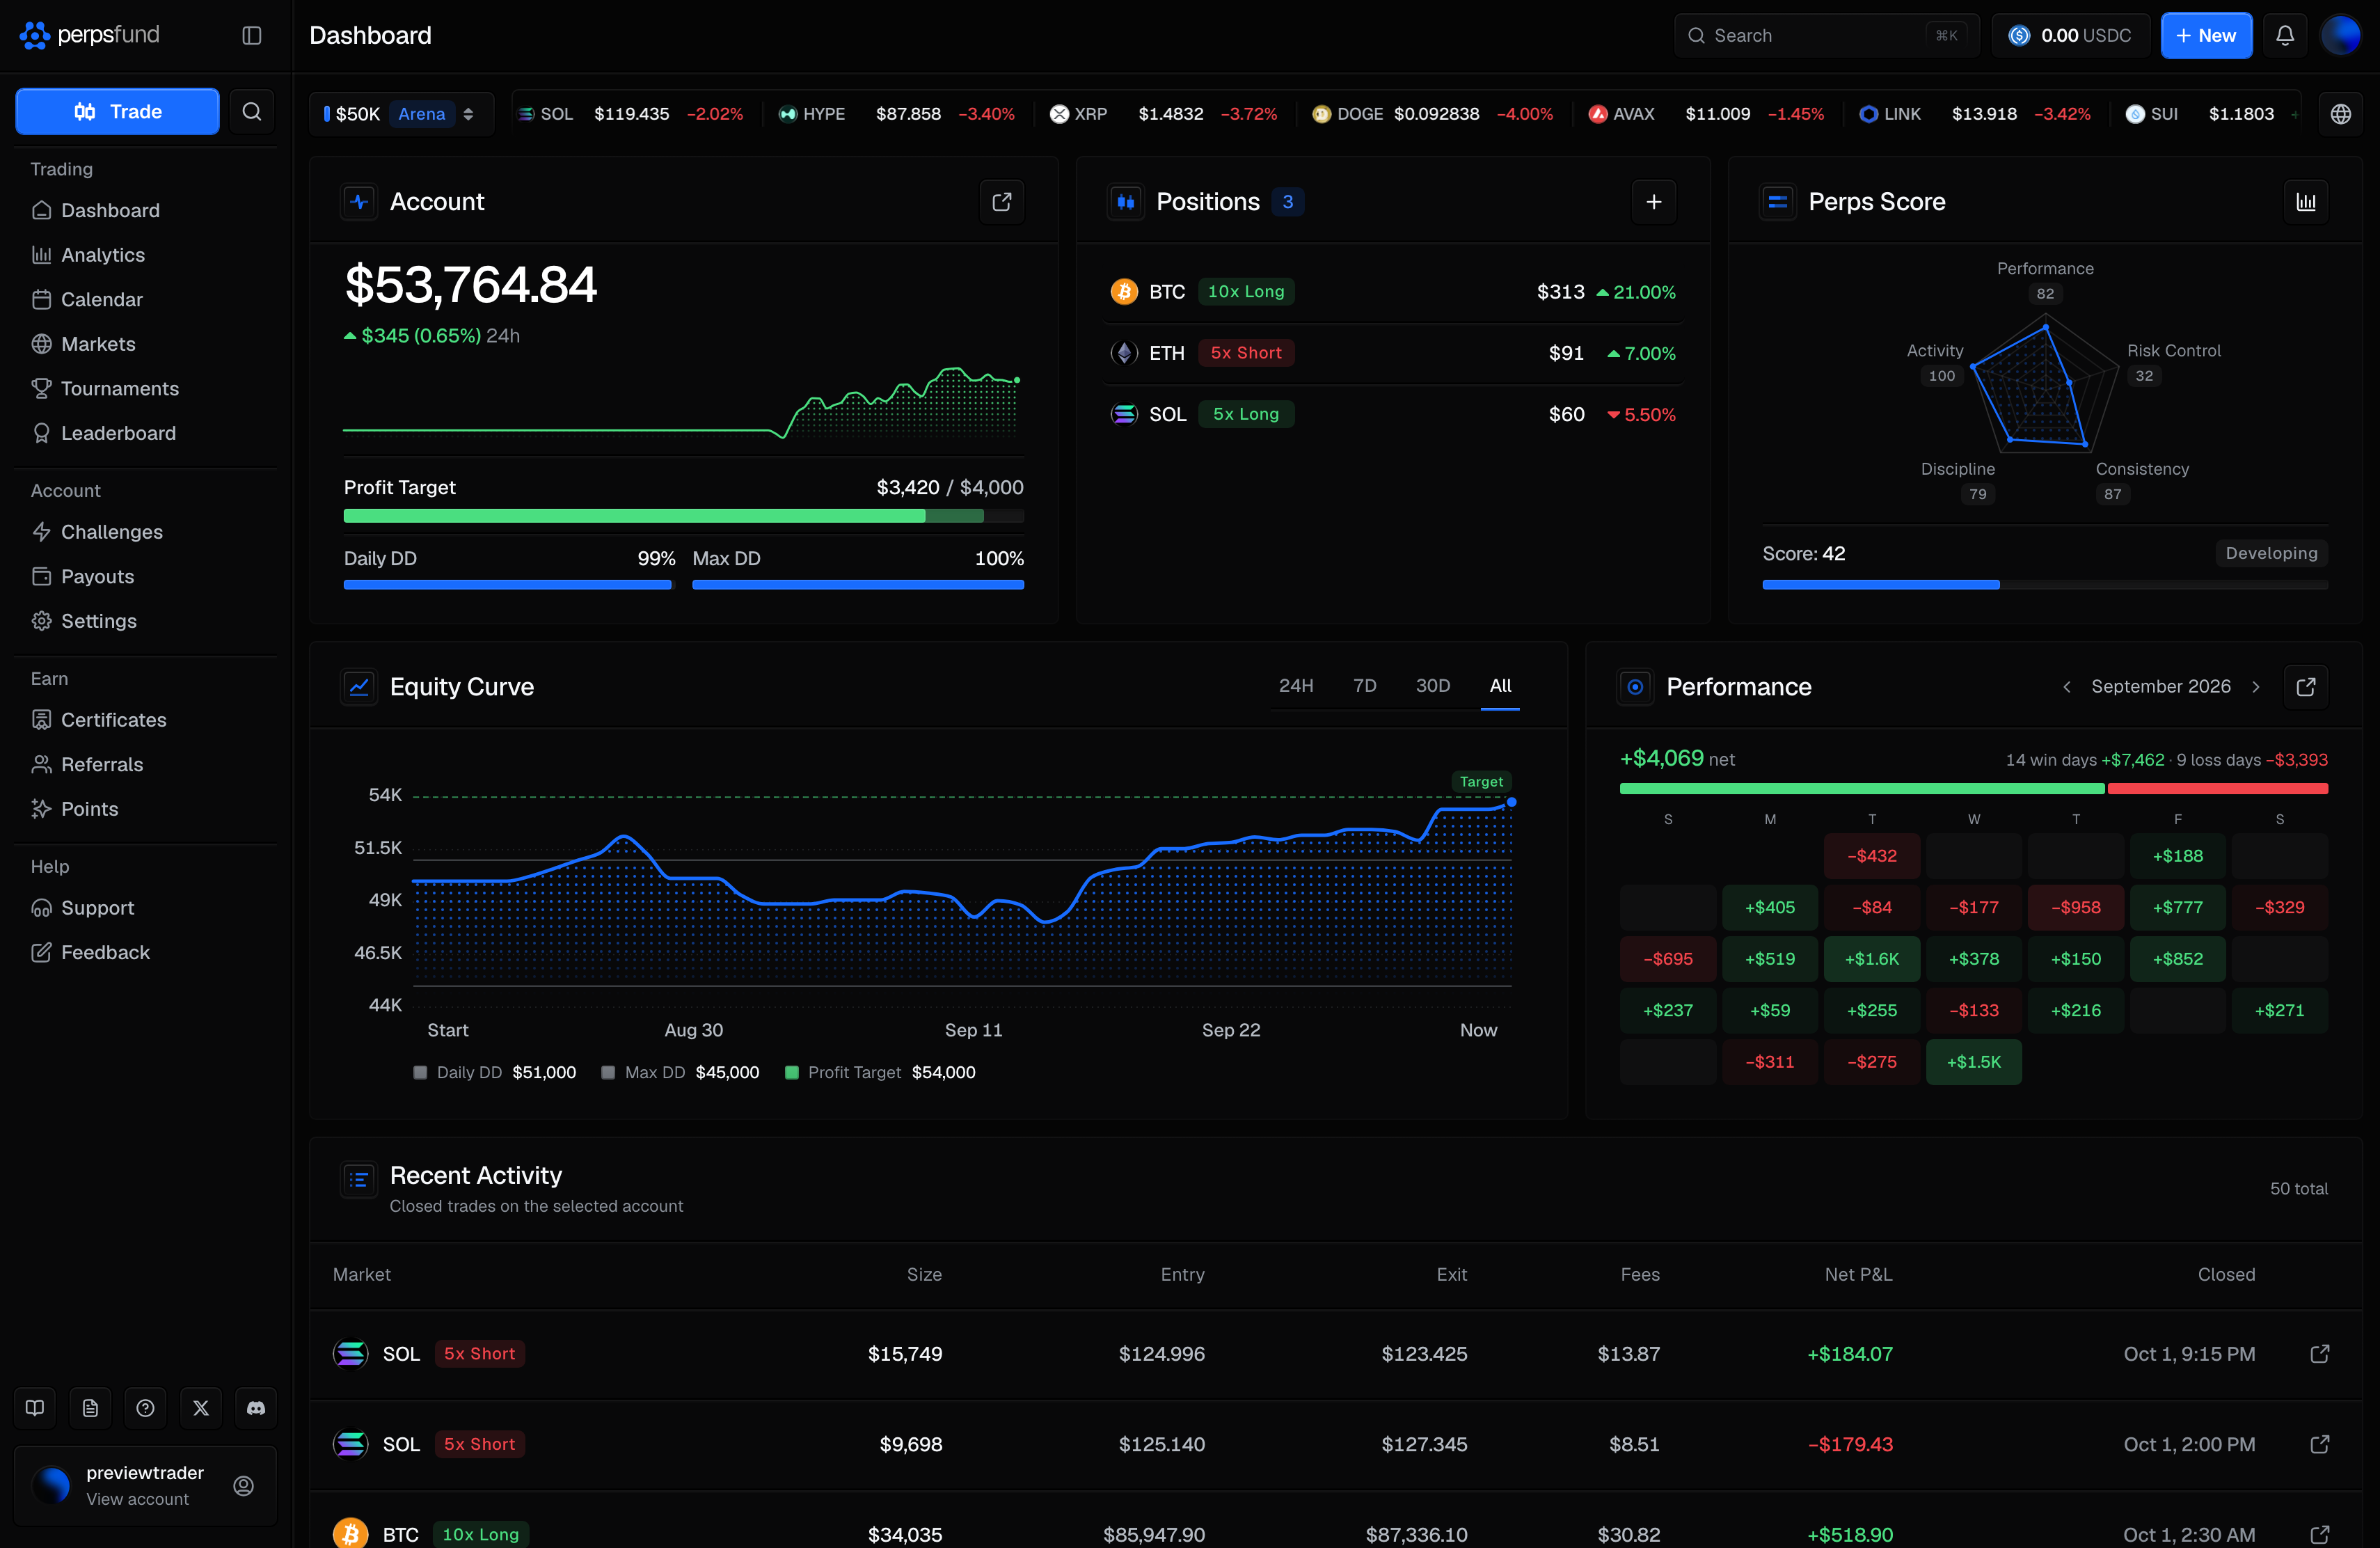
The header
On a computer the header is a bar across the top of the page, level with the sidebar's logo row, and it stays in place as you scroll.
| Control | What it does |
|---|---|
| Search | The search bar at the left of the header's controls, reading Search with the Cmd/Ctrl + K key hint. It opens platform search, the same panel Cmd/Ctrl + K opens anywhere in the app. It searches settings, rules, the FAQ, these docs, pages, actions and markets. Until 29 September 2026 it was a magnifier button between New Challenge and the bell. |
| Withdrawal | The button with the USDC mark and the amount you can withdraw now, for example 2,350.00 USDC: the same figure the Payouts page shows as Available to request, always with two decimals. An account with nothing to withdraw yet (a new account, one not in profit, or a free trial) reads 0.00 USDC. It opens the payout request on the page when one of your funded accounts can be paid. On an account that is not funded yet it is still pressable, and opens the payout window on an explanation of when payouts unlock together with an Add wallet button, so you can whitelist a wallet early. On a funded account that is blocked for another reason it stays visible but disabled, and the info dot beside it says what is missing: identity verification, a payout wallet, a wallet that is still locked, positions to close, or the minimum. After you request, it reads Payout requested with a View history link. |
| New | The blue button with the +. Opens the Challenges page. It read New Challenge until 29 September 2026. |
| Notifications (the bell) | Opens your notifications in a panel that drops below the bell, lined up with its right edge. They are grouped under Today and Earlier, with Mark all read. A dot marks unread ones. Selecting one marks it read and opens the page it points to. Which notifications you get is set in Settings. |
| Your avatar | At the far right, after the bell: the same ringed avatar as the terminal's top bar. It opens your account menu (see below). |
The account menu
On a computer your avatar opens a menu that drops below it, under an Account label. On a phone the blue + in the header opens it as a sheet from the bottom, titled Account.
On a computer the rows look like the terminal's More menu: an icon and a name. On a phone they are the same dark buttons as the More sheet at the bottom of the app, two to a row.
| Row | What it does |
|---|---|
| Public Profile | Opens your public trader profile, the page other traders see. With no username set yet it opens Settings, where you set one. |
| Challenges | Phone only. Opens Challenges to buy an account. On a computer, New in the header does this. |
| Referrals | Opens Referrals: your invite link and what it has earned. |
| Points | Opens Points: your balance and rewards. |
Under the rows, on both, sit a Join Discord button, which opens the Perps Fund Discord server, and below it Support and Feedback side by side. On a computer these three buttons are smaller than on a phone. Support opens the Support window (live chat, Discord, email or feedback; see Support) and Feedback opens the report form. To link your Discord account, use the Connections card in Settings.
A payout itself always draws from one account; how that works is on Payouts.
The markets ticker
To the right of the account switcher, a ticker scrolls live prices and 24h change for leading markets. The icon button at its end picks the source:
| Source | Markets |
|---|---|
| Hyperliquid | Crypto perpetuals. This is the default. |
| TradFi | Stocks, indices and commodities. |
The choice lasts for the visit only. Every time the page loads, the ticker starts on Hyperliquid again.
The account switcher
During beta you hold 1 live paid challenge account at a time. The switcher also lists your free trial, your tournament entries, and accounts that have finished (breached, passed, or a tournament that has ended). The button shows the selected account's size and badge, with a short upright line in the badge's colour just before the size, as tall as the size text itself; the same line tags the account on the phone and in the terminal. Selecting it opens Switch account.
| Element | What it shows |
|---|---|
| Tabs | All, Active, Passed (passed and funded accounts), Breached, and Archived. Every tab except Archived leaves archived accounts out. |
| Account row | The size ("$50K Challenge"), a badge, the balance and its profit or loss. The profit or loss has no plus or minus sign: a small triangle before it points up in green or down in red, and a level account shows none. The badge is the product line (Arena | 1-Step, Gauntlet | 1-Step, Hyper | 1-Step, and Arena | 2-Step, with the phase on a two-phase line), the tournament's name, Free trial, Funded, Passed, Breached, or Expired. A passed challenge whose funded account has been issued also reads Read-only. |
| Archive / Unarchive | On finished accounts only. See below. |
| New Challenge | Opens Challenges to buy another account. It read Manage accounts and returned you to the Dashboard until 21 September 2026; the Dashboard is the first row of the sidebar and the first tab of the phone's bar, so that button spent the panel's one blue action on a page already one tap away. It is drawn like every other blue button in the app, including the New button in the header above: a lit top edge and no glow beneath it. Until 21 September 2026 it was drawn with an older recipe and was the one blue button in the product that did not match its family. |
Selecting an account focuses the whole page on it. The choice is remembered, and Analytics and the terminal open on the same account.
Archiving an account
You can archive an account that can no longer trade: a breached account, a passed challenge, or a tournament entry whose tournament has ended. Live, funded and in-evaluation accounts have no Archive control, so archiving can never hide an account you can trade.
- Archive moves the row to the Archived tab straight away. If the server refuses, the row moves back and a message says so.
- Unarchive, on the Archived tab, returns it to the other tabs. You can switch back and forth as often as you like.
- An archived account can still be opened and reviewed from the Archived tab.
- Archiving hides the account from the lists, nothing else. Its trades still count in Analytics' All accounts, in the Calendar, and in your certificates.
- The same controls are on the phone, in the account sheet.
When the Dashboard opens, it shows the account you last selected, unless that account has breached or its tournament has ended. Otherwise it picks an account in evaluation, then a funded account, then a passed one, and prefers accounts you have not archived. An archived account still opens if it is the only one you have.
Before your first account
Before you hold a challenge, the Dashboard is still the Dashboard. It is the same page described on the rest of this doc, with every figure at zero: the same header, the same account switcher and markets ticker, the same Account, Positions and Perps Score panels, the same equity curve, the same month calendar, the same recent activity list. Nothing is hidden and nothing is a placeholder, so the page you learn on your first day is the page you keep.
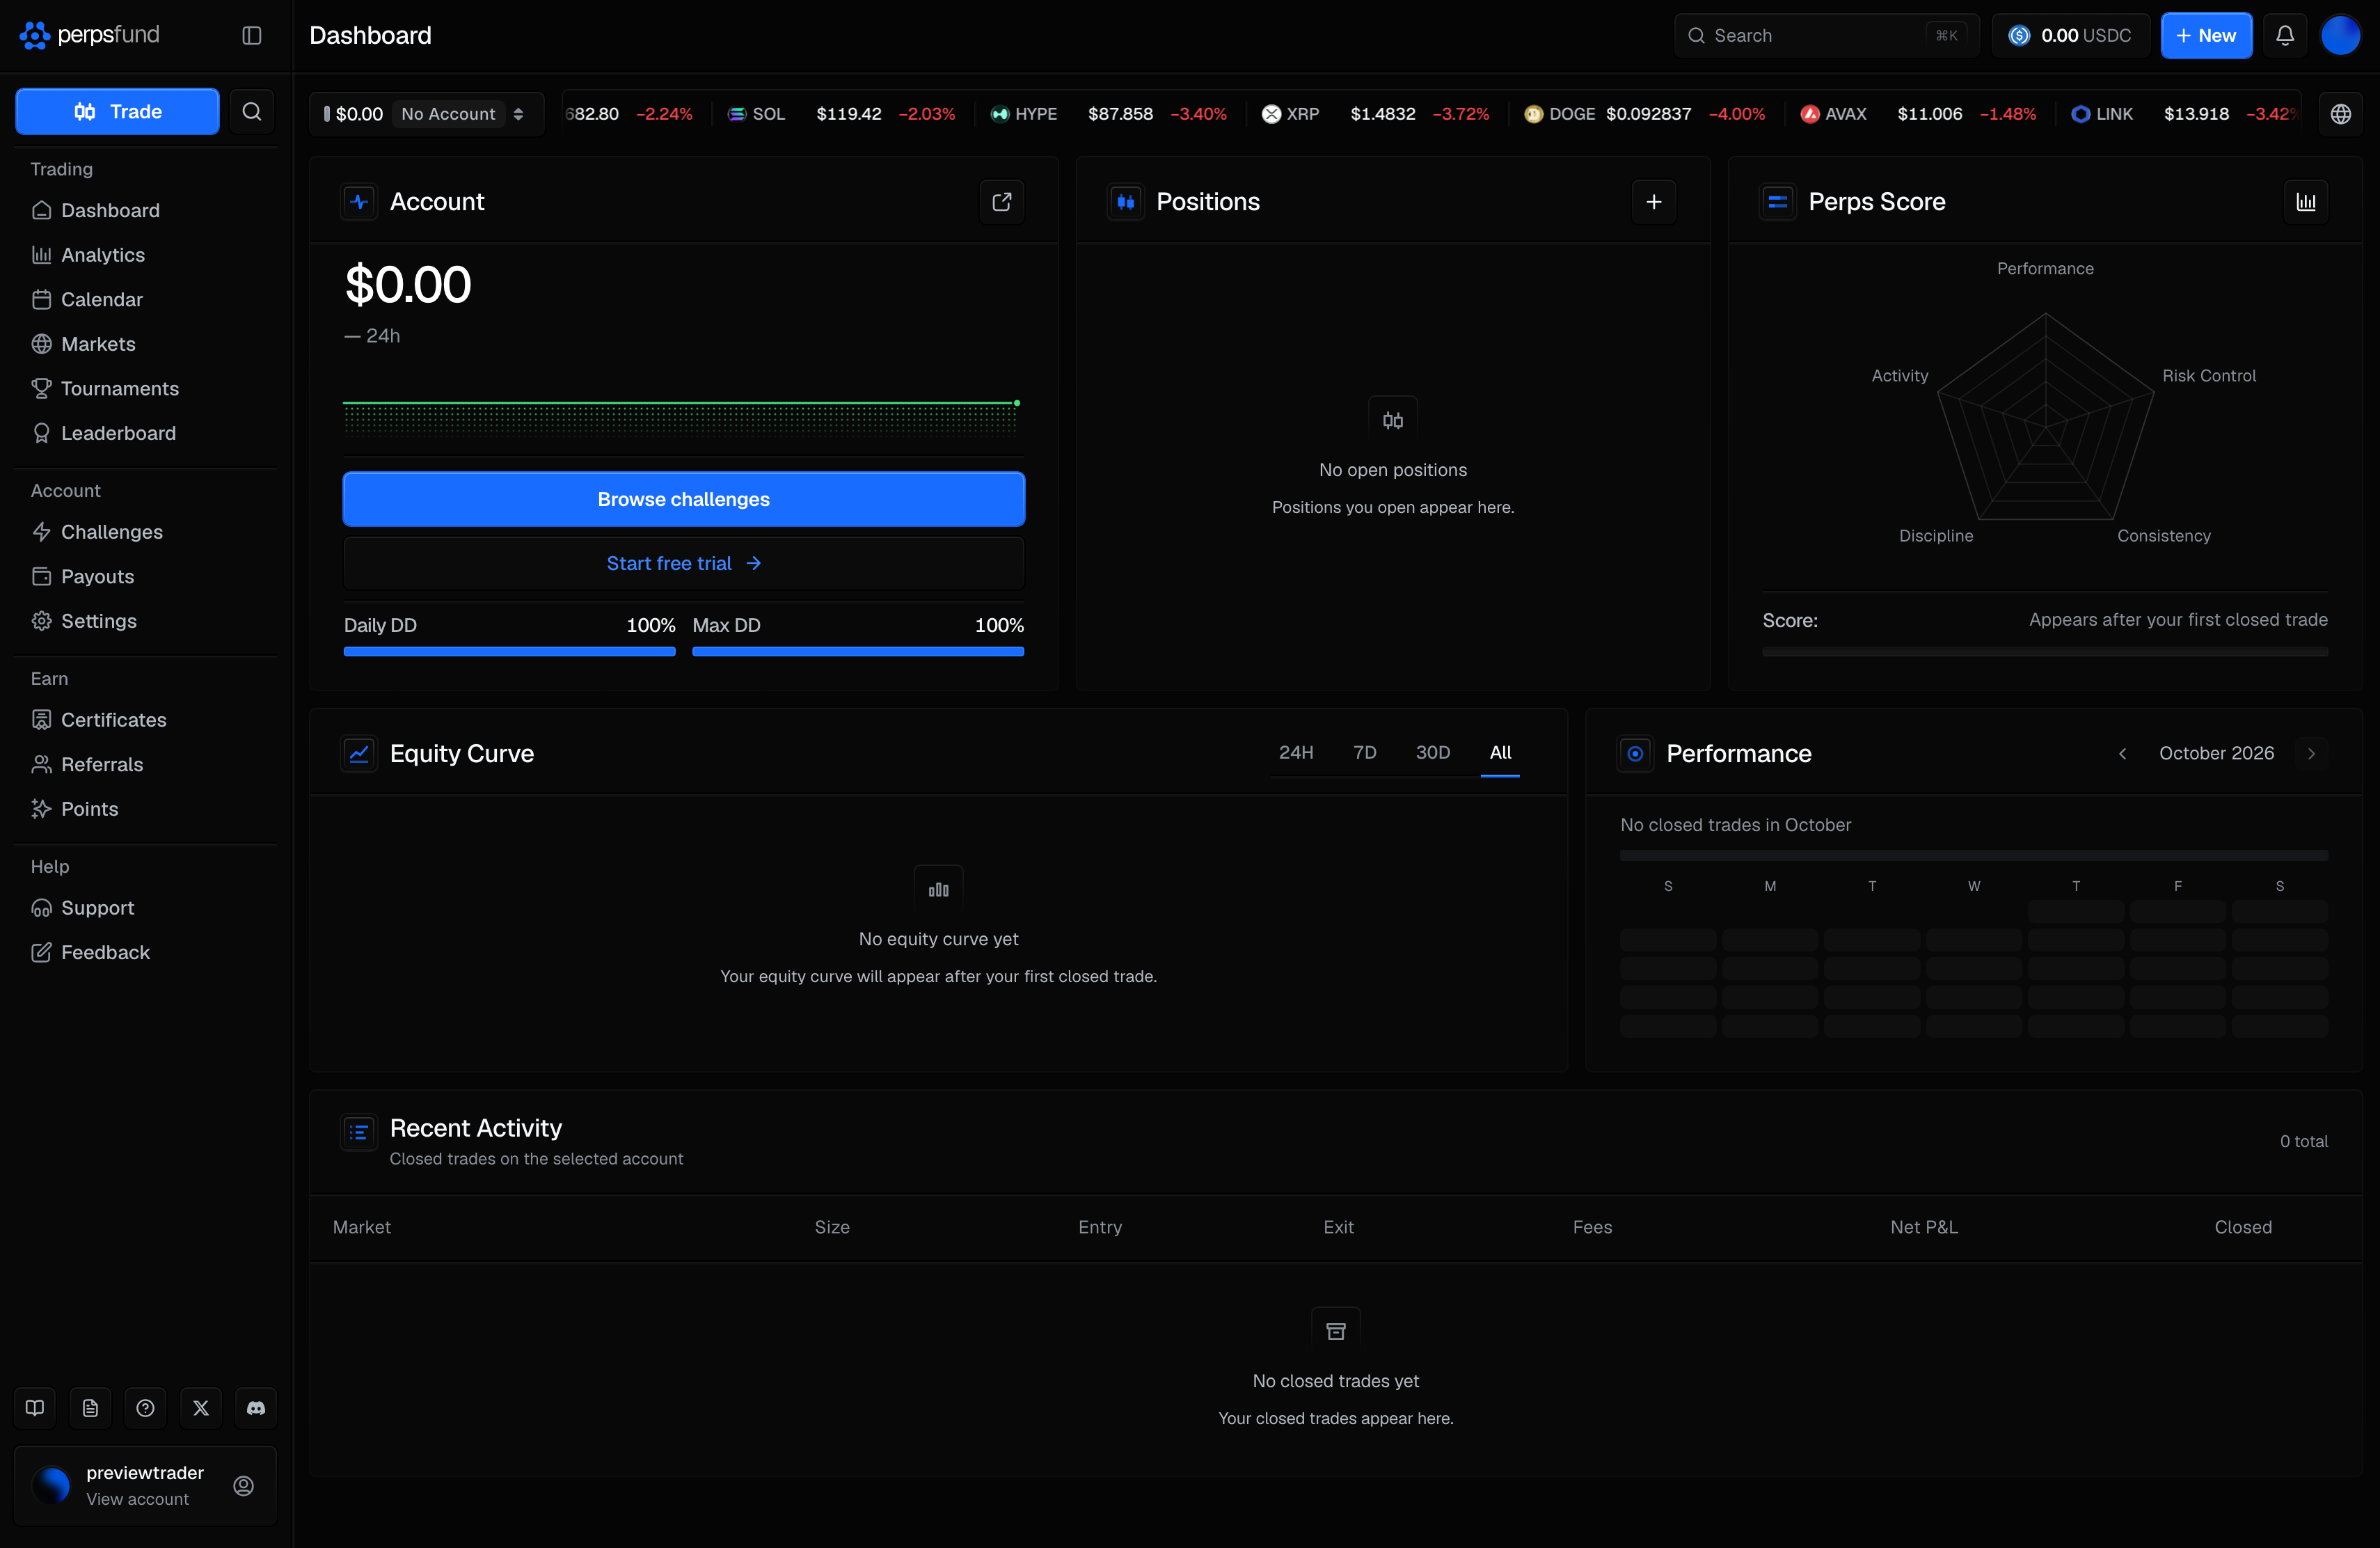
Four things are different from the account-holding page, and that is the whole list.
| What | Before your first account |
|---|---|
| The account switcher | Reads $0.00 with a grey No Account badge. It still opens Switch account, which has no accounts to list and says so, with Browse challenges under it. |
| The Account panel's readout | Where an account in evaluation shows its Profit Target, there are two buttons instead: Browse challenges and, under it, Start free trial. |
| Withdrawal | In the header, reading 0.00 USDC, and pressable. It opens the payout window on an explanation of when payouts unlock and an Add wallet button. A payout wallet sits through a 48h lock before it can receive anything, so adding one before you are funded is worth doing; requesting a payout still needs a funded account and cannot be reached from here. The search bar, New and the notification bell all stay. |
| The equity curve | Reads "No equity curve yet" and "Your equity curve will appear after your first closed trade" instead of drawing an axis. The 24H / 7D / 30D / All tabs stay. |
Everything else is the page's own arithmetic over an empty account. Equity is $0.00 with a flat sparkline. Positions reads "No open positions". Performance says "No closed trades in" followed by the month, and Recent activity is "0 total" with "No closed trades yet". The Perps Score reads "Appears after your first closed trade". In the Account panel, Daily DD and Max DD both read 100% over full bars: you have lost nothing, so all of the room is still yours. The phone shows the same two meters the same way.
The two buttons
Browse challenges opens Challenges, where you pick an account size and a challenge type and buy one. This is the paid path and it is the one the page leads with.
Start free trial opens the free trial offer over the page, without leaving it. A trial is a real $5K one-step evaluation on the same live-priced markets, with no card and no payment, and it is the one account here that cannot be funded. Closing the offer, with the X, the Escape key, a click outside it, or a swipe down on a phone, returns you to the Dashboard. The free trial covers the rules in full.
What the offer says depends on whether you can start one, and it is resolved before the page renders, so it never offers you a trial you would then be refused:
| Your situation | What the offer says |
|---|---|
| You can start one | The trial's real terms (account size, profit target, max drawdown, daily loss, no time limit) and Start your free trial. |
| Your email is not verified yet | One step to your free trial, and Resend verification email. Verify it, come back, and the offer is there. |
| You have already used your trial | You have used your free trial. One per person. |
| Another account on this device has used one | This device has had its free trial. One per person and one per device. |
| The trial's challenge line, or its account size, is not on sale | The free trial is paused. It returns with the line it runs on. |
In all four of those, closing the offer is the way back, and the page behind it already carries Browse challenges as its primary button, so the offer does not repeat it.
Before your first account, on a phone
The phone gets the same treatment on the phone Dashboard described further down: the account chip reads $0.00 · No Account, and the two buttons sit where the Profit Target readout does, above Daily DD and Max DD. The account sheet it opens says you have no account yet, with Browse challenges under the line.
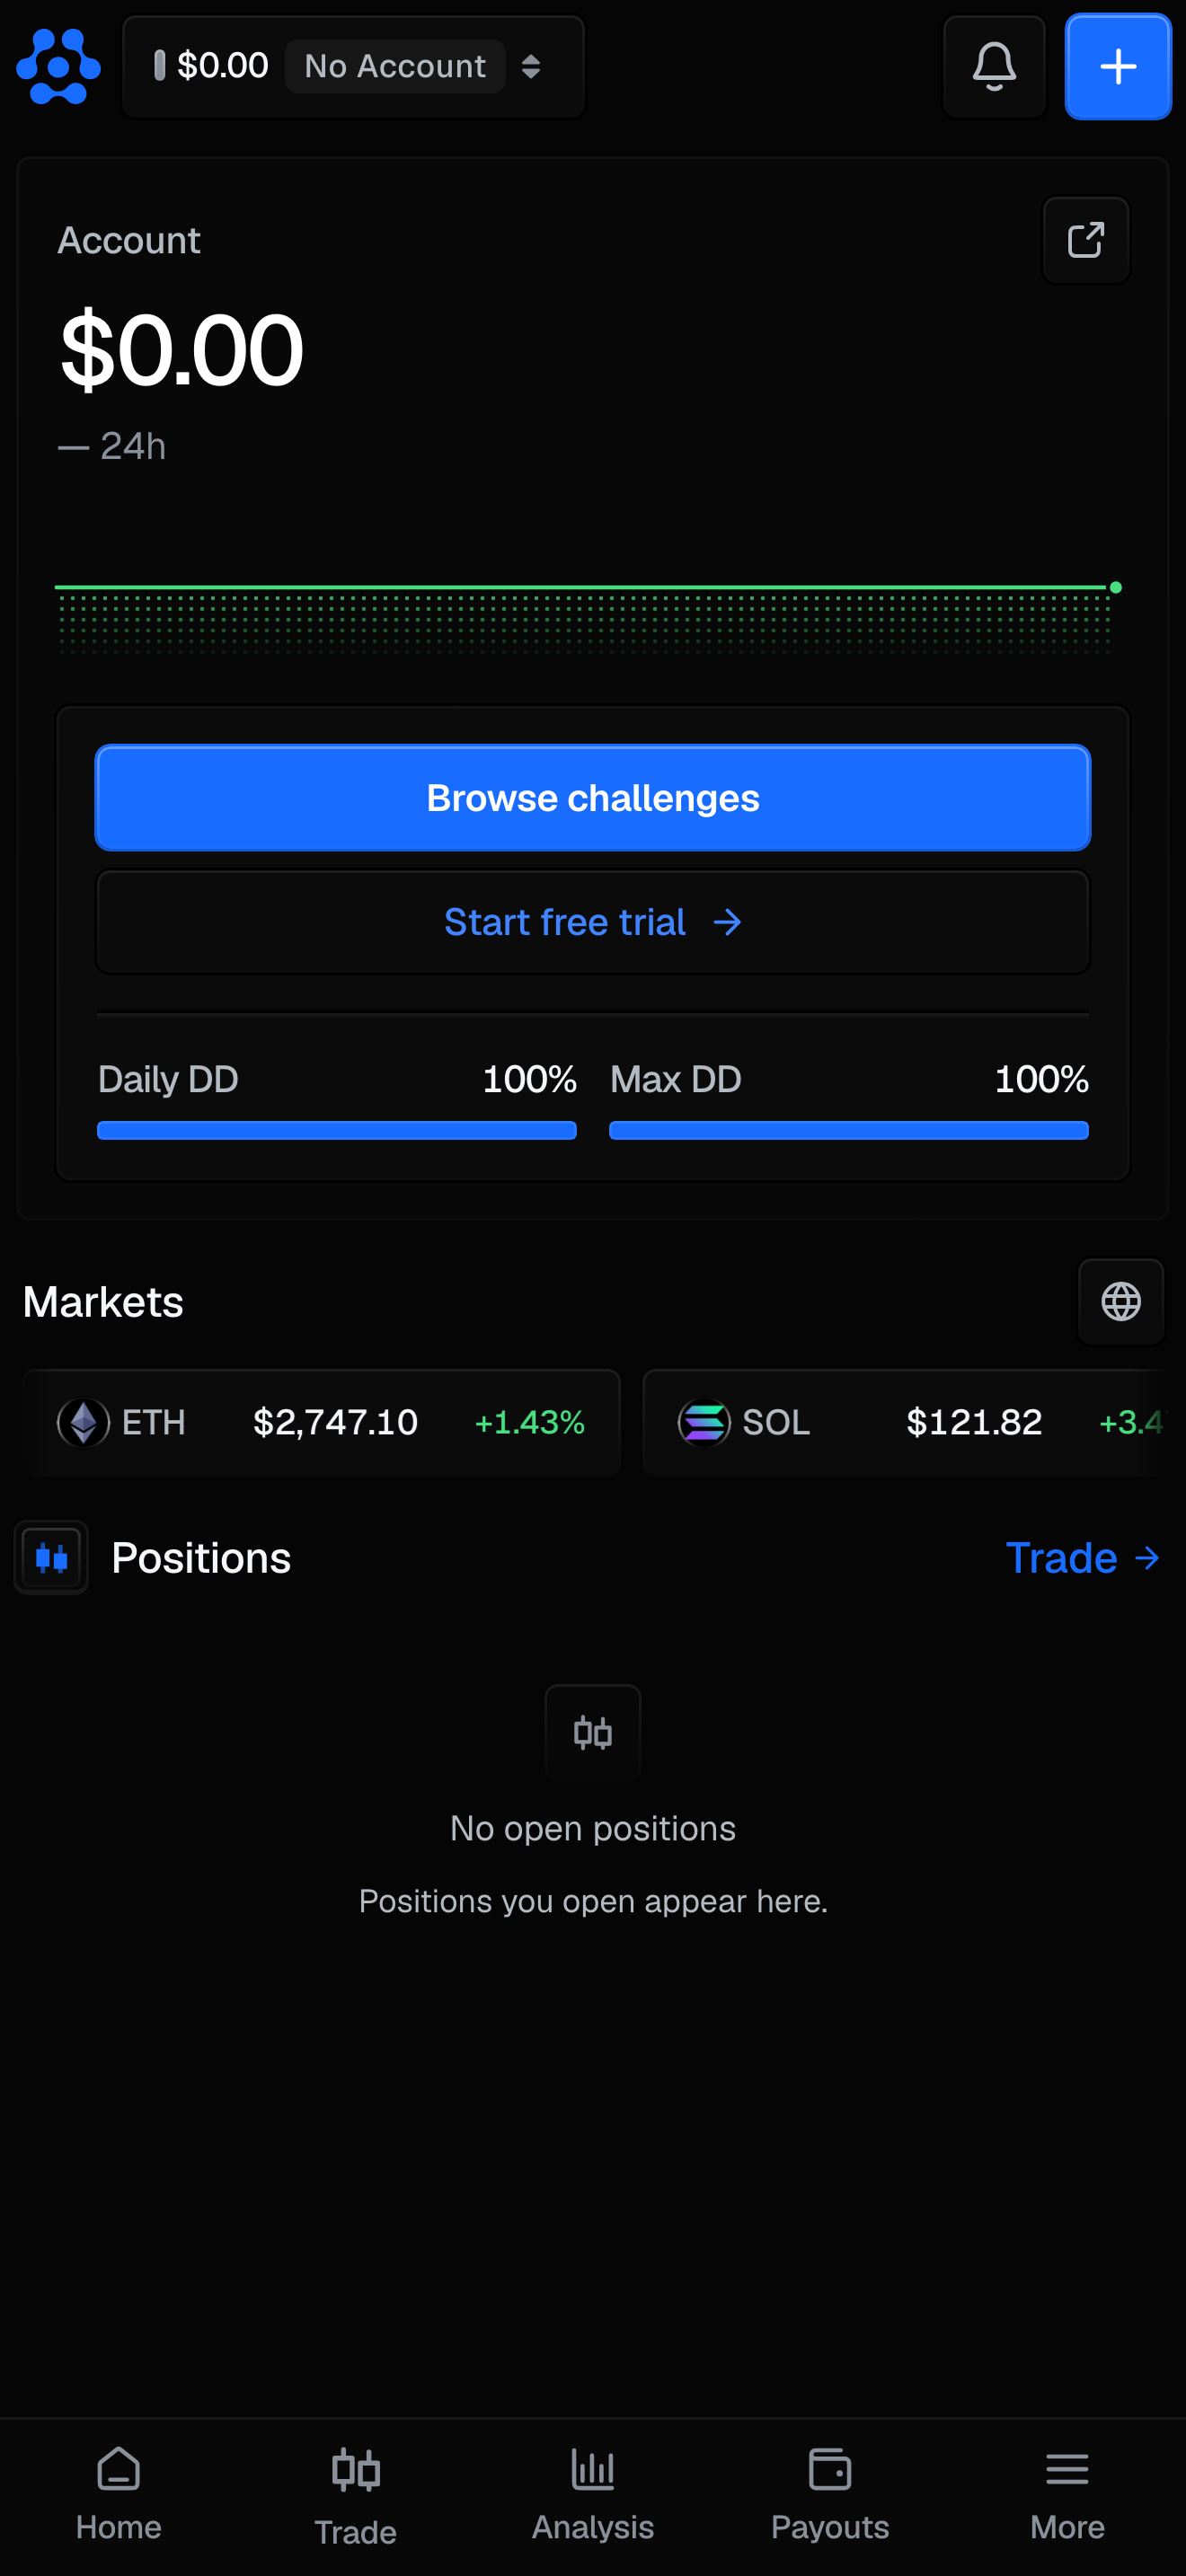
The verify-email nudge
If your email is not verified, the nudge at the top of the page reads Verify your email to start your free trial while you hold no account, because that is what verifying unblocks for you first. Once you have an account it returns to Verify your email to secure your account and enable payout wallets, which is what it unblocks then. On a phone each is shortened so the nudge stays on one line: Verify your email to start while you hold no account, and Verify email for payouts once you have one. In a language whose sentence is longer than the line, the resend button and the dismiss control move to a second line under the sentence. Either way it offers the resend, and dismissing it hides it for the rest of the session.
If you have just paid
A challenge you have paid for but which has not confirmed yet shows a Payment in progress card at the top of the page, above everything else. See A payment in progress.
The Account panel
The first panel is the account itself.
| Element | What it shows |
|---|---|
| Equity | Your live equity: balance plus the profit or loss on open positions. |
| 24h | How much your equity has changed over the last 24 hours, in dollars, then in brackets as a percentage of your equity at the start of those 24 hours, for example $2,397 (2.40%) with a small green triangle pointing up before it. The triangle and the colour show whether it went up or down: green pointing up, red pointing down. An account that started less than 24 hours ago (opened, moved to a new phase, or funded) is measured from the balance it started with, so a first trade shows its result straight away. If the account has not moved in the last 24 hours, the figure is the change over the last 24 hours in which it did (ending at its last trade) and the word 24h is left off, because it is not the last 24 hours. An account that has never traded shows $0 (0.00%) with no word after it. A dash shows only if no reading of the account exists at all. |
| Sparkline | The same 24 hours as the figure: your equity with a reading every 15 minutes and one at every trade, ending at your live equity, or ending at your last trade when the account has been idle. It is scaled to that window's own high and low, so even a small move shows, and is red when it ended lower than it started and green otherwise. A grid of small dots in the same colour fills under the line, fading toward the bottom, and a dot marks the end. Whatever the window holds is drawn across the full width of the line. An account that has never traded draws a flat green line with its dots. While the page is still loading your live equity, the line is the same flat green line across the full width, so it never shows a direction it does not know yet; the real line replaces it in the same place. |
| Share (icon) | Opens the performance card for this account. See PnL cards. |
| The readout | Depends on the account, below. |
In evaluation: Profit Target. The readout shows your closed profit against the target's dollar gain ("$3,400 / $4,000") and a bar. The solid part of the bar is closed profit, which is what the target counts. A dimmer extension shows profit on open positions, which counts once you close them. When the target is reached or your open profit would clear it, a note under the Performance panel says what is left to do. The target for each type is on How it works, and the pass rule is in Trading rules.
Funded: one payable line. There is no bar. The line reads Profit: followed by what you can request from this account now (your share, never below zero), a grey badge with your 80% split, and one button. The button reads Payout, with the USDC mark, when a request is possible and opens the request on this account. Otherwise it names what is in the way: Close positions first, Verify to withdraw, Add a payout wallet, Wallet locked, $50 minimum, or Nothing to draw.
Tournament: your rank. Your avatar sits before Rank:, as tall as the words. The line reads Rank: with your place and the field size ("#3" and "of 47"), or Unranked, Disqualified or Under review, plus a Leaderboard link to the tournament's standings. When you hold a rank, a share button makes a rank card. Selecting the rank shows when it was last updated. The Tournament page covers ranking in full.
Under the readout: Daily DD and Max DD. Side by side, under a thin line: each is the whole percentage of that allowance you have left, with its own bar, blue while the cushion holds and red below 20%. A figure never runs into the label beside it: on a window too narrow for both on one line, Max DD sits under Daily DD. It is the same row as the phone's and the terminal's Account section. Hover the Daily DD label to see the countdown to the daily reset ("Resets in 18h 10m", at 00:00 UTC). Hover the Daily DD figure to see what the allowance is: its percentage of your balance at the 00:00 UTC reset, raised by any gain you bank today, and today's floor. A limit the account does not set reads No limit with no bar, and there is no countdown on an account with no daily limit. Neither figure goes above 100%.
When an account breaches or passes, this panel changes; see Finished accounts.
Positions
The Positions panel lists the account's open positions with a count beside the title, one line each: the market's icon, the market, a badge for the side and leverage (for example 5x Long), and the position's size in USDC, shortened and rounded down (for example 14.6k USDC); then, at the right, the open profit or loss in dollars, white with no plus or minus sign, and the return on margin, for example 5.31%. The percentage has no sign either: a small triangle before it points up in green or down in red. The rows share their columns, so every market, badge, size and figure lines up with the ones above and below it. The market's name always shows in full, even the longest (LAUNCHCOIN): when the panel is narrower, the row gives up the size first and then puts the percentage under the dollar figure. A row gives up its icon only when its own market name would not otherwise fit, so a row with a short name (BTC, ETH) keeps its icon at every window width, and only a row with a very long name can lose it. On a 1440 px window with the sidebar open the size is hidden; on 1280 px the percentage sits under the dollar figure. (From 25 to 26 September 2026 each row was two lines, laid out like the phone's.) Selecting a row opens that market in the terminal, and the + button at the top right of the panel (its label is New trade) opens the terminal on this account. With nothing open it reads "No open positions".
Perps Score
The Perps Score panel scores how you trade on this account, from 0 to 100. It is private to you. On a computer it is on the Dashboard; on a phone it is on Analytics, under the equity curve, and not on the phone Dashboard. A radar shows the five things it is built from, each with its own score in a small grey badge under its name:
| Axis | What it looks at |
|---|---|
| Performance | Your return against the target, your profit factor and your average result per trade. |
| Risk Control | How much of your maximum drawdown you have used, the worst share of a day's allowance you have used, and your worst single trade against a day's allowance. |
| Consistency | How many of your trading days were green, how much of your profit came from your best day, and how steady your daily returns are. Needs two trading days. |
| Discipline | Whether you size up right after a loss, how steady your position sizes are, how often an order was refused at a limit, and whether your positions carried a stop loss. |
| Activity | How many trades and trading days the score has to go on. Very small trades do not count. |
Hover a point on the radar to see what went into that axis. An axis with nothing to go on yet shows a dash, and the hover says why. A shaded spoke means the axis is scored on less than half of what it looks at.
Under the radar, Score: gives the number, with a bar under it and its band in a grey badge at the bar's top right: Needs work below 40, Developing from 40, Disciplined from 60 and Elite from 80. The score counts your four skill axes together and leans on Activity: with only a few trades it stays close to the middle. It never sits more than 10 above your Risk Control score; when that holds it down, hovering the number says so. Before your first closed trade the radar is empty and the panel reads "Appears after your first closed trade". The analytics button at the top right of the panel (the same icon as Analytics in the sidebar; its label is Open analytics) opens Analytics for this account.
The score covers this account since it started, or since it last moved to a new phase or was funded. Stop use and the worst share of a day's allowance are recorded from 26 September 2026, so older days do not count toward them.
How the floors are measured
The Daily DD and Max DD meters show your cushion. How equity is measured, what counts toward a breach, and when the daily floor resets are defined in Equity-based limits in the Rules and explained in Trading rules. Rule changes are dated in the Rules changelog.
The equity curve
The Equity Curve panel charts the account's equity over time, with range tabs 24H, 7D, 30D and All (the default). Each range draws your equity at a regular step and ends at your live equity:
| Range | One point every | Taken from |
|---|---|---|
| 24H | Hour | A reading of your equity taken every 15 minutes. |
| 7D | 2 hours | The same readings. |
| 30D | Day | Your equity at 00:00 UTC each day. |
| All | Day | The same, since the account opened. |
Each point is your equity at that moment, never an average, so a swing inside the day shows. An account younger than the range draws from the moment it opened, across the full width of the chart. The 15-minute readings began on 24 September 2026; until there are 7 days of them, 7D draws the readings that exist, also across the full width.
The dollar axis on the left carries four or five labels, evenly spaced. On an account in evaluation the top label is your profit target exactly, and the labels step down from it by 1, 2, 2.5 or 5 of a power of ten (for example $110K, $105K, $100K, $95K, $90K) until they reach below everything the chart shows: your equity over the range and both loss floors. Of four and five labels, the chart takes whichever covers that with less spare room, and five when the two are even. A funded account, or one with no target, keeps round steps: they take in your two loss floors as well as your equity over the range, with a little room above and below, and never span less than 1% of the starting balance.
A very faint grey dotted line runs across the chart at every label. The line is blue from end to end. Under it, a halftone of small blue dots fills the chart down to its floor (brighter since 29 September 2026), strongest in the upper half and fading out near the bottom. A dot marks your equity now, at the right-hand end of the line. Until 26 September 2026 the chart had no gridlines.
The levels that matter are drawn as thin lines across the chart: the two loss floors solid, and the profit target a dimmer, dashed green (it was solid and brighter until 29 September 2026). The profit target carries a green Target badge just above it at the chart's right-hand edge; when your latest point sits right there, the badge moves left of it so it never covers the dot. No other level is labelled on the chart itself. A legend under the dates names each one with its value:
| In the legend | What it is |
|---|---|
| Daily DD | Today's loss floor, a dim grey line. |
| Max DD | The maximum-drawdown floor, a dim grey line. |
| Profit Target | On an account in evaluation, the target, a dimmer dashed green line. Funded accounts have no target. |
The target and both floors are always on the chart. A limit the account does not have is not drawn or listed; a tournament without limits has no lines and no legend. Once an account in evaluation passes, a dot marks where the curve first crossed the target.
Point at the chart to read it: a dotted line follows the pointer, a dot sits on the curve, and a small box just above the dot shows the time and your equity at that point. Near the top of the chart the box sits below the dot instead, and near either side it moves in so it stays inside the chart; it never covers the dot. The part of the chart to the right of the pointer dims. The dates under the chart never overlap: when they would, fewer are shown.
Before your first closed trade the panel reads "No equity curve yet".
Performance
The Performance panel is a small calendar of the current month. A line at the top gives the month's net result, the number of win days and loss days with their totals, and a bar splitting gross wins from gross losses. Each traded day shows its result; hover a day for its date and figure. The arrows step back through earlier months. The share button to the right of the month opens the calendar share card for the month you are looking at, the same card as the Calendar page's Share. It shows once the account has a closed trade. The full calendar, with all-time streaks, is the Calendar page.
Recent activity
Recent Activity lists the latest closed trades on the selected account, newest first, with the account's total trade count beside the title.
| Column | What it shows |
|---|---|
| Market | The market, with a badge beside it for the side and the leverage the position had when it closed, for example 5x Long. There is no separate Side column. |
| Size | The position's notional value in dollars. |
| Entry, Exit | The average entry and exit prices. |
| Fees | The trade's fees, already taken out of Net P&L. |
| Net P&L | Profit or loss after fees. |
| Closed | When the trade closed. |
| Share (icon) | Opens the trade card for that trade. See PnL cards. |
The list shows the latest trades only. Every closed trade, with sorting and export, is in Analytics under Trade History.
Finished accounts
When an account can no longer trade, its panels change to a record of how it ended.
| Account | What the Dashboard shows |
|---|---|
| A passed challenge | "You passed", with the profit, and a button to Open funded account. The account is read-only and keeps its history. The Perps Score panel becomes Result: the date it passed, its profit and its target, which no longer change. |
| A tournament entry that has ended | The Perps Score panel becomes Result, marked Final: the tournament, your final rank, and your P&L. |
| A breached account | A notice that trading is disabled, with buttons to start a new challenge, and, in place of the Perps Score, a locked panel with the starting balance, the floor that was crossed and the final balance. See the breach record on that panel opens the full record in a window (a sheet from the bottom on a phone): when the account locked, the floor and how it was worked out, the final balance, the closes, and where the figures come from. See Breach disputes. |
| A passed free trial | A pass notice with the offer to buy a challenge. |
Moments
A few events open a one-time window the next time you visit the Dashboard soon after they happen: a challenge you have bought, a free trial you have started, clearing phase 1, passing, reaching funded, a breach you were away for, a passed free trial, and a payout that has been sent. Each shows once, across all your devices. The challenge-started, milestone and payout-sent windows offer a share card.
A payment in progress
If you have paid for a challenge and the payment has not confirmed yet, a Payment in progress card sits at the top of the Dashboard with the challenge, the amount and currency, and the payment's progress. Your challenge activates by itself once the payment confirms, and you do not need to keep the page open. View payment opens the Challenges page with the payment's window already open: the payment window while it is waiting for you, the progress window once it has been seen. The Challenges page shows the same payment in a strip at its top. The card disappears once the account exists.
On a phone
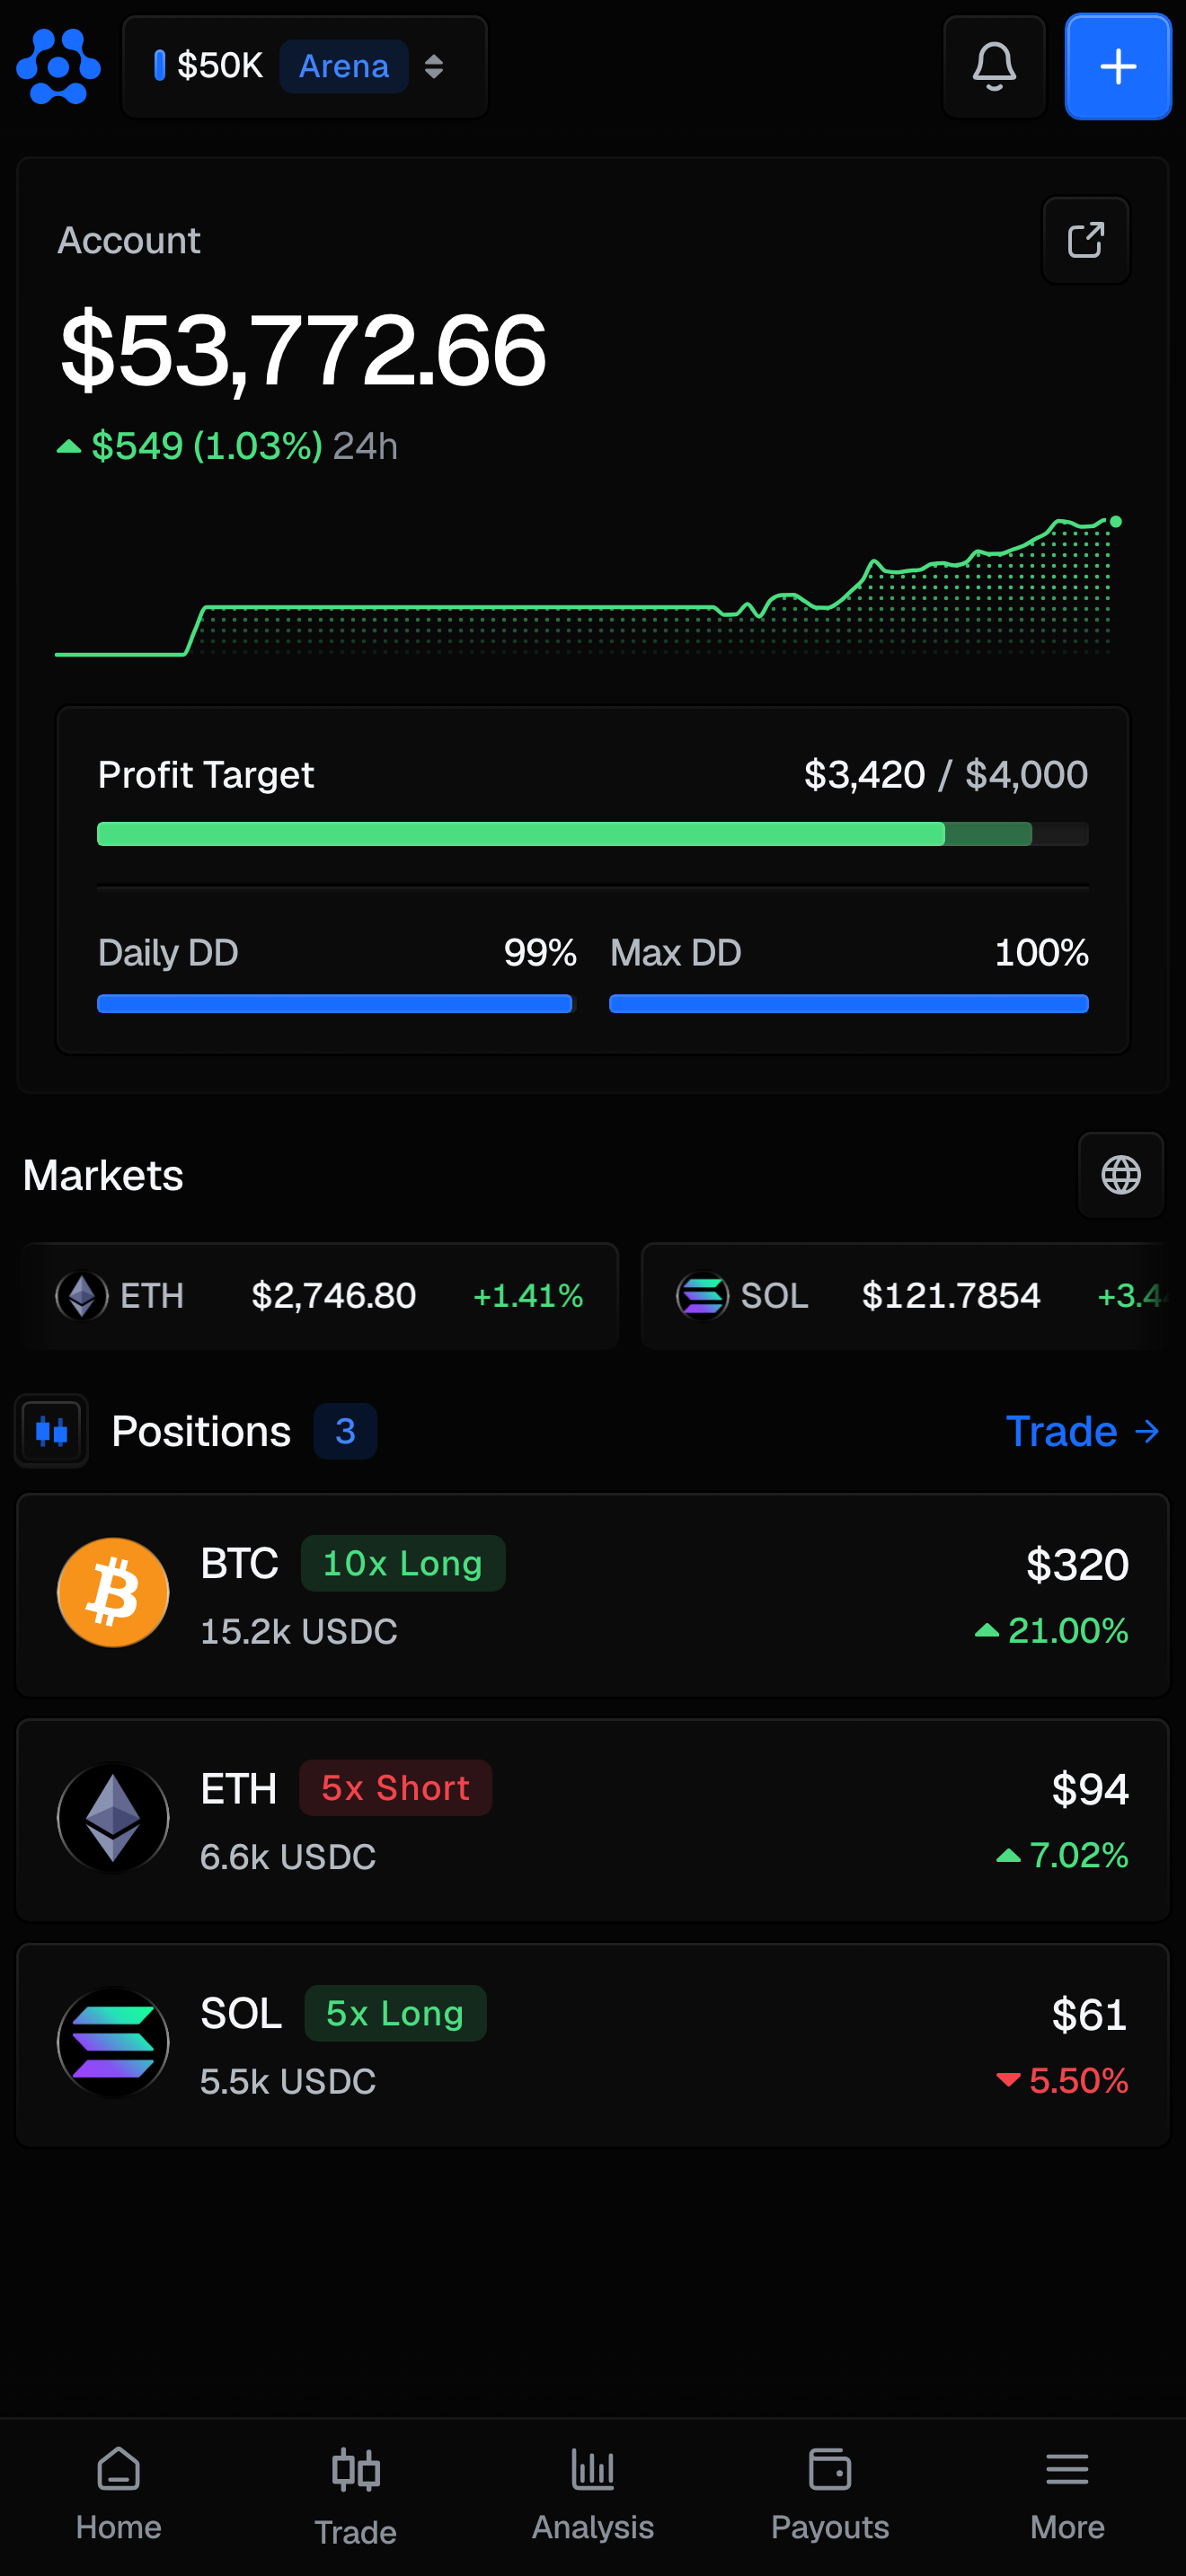
On a phone the Dashboard is a shorter, single-column page.
| Element | What it does |
|---|---|
| Header | The logo at the left leads back to the dashboard. The account chip beside it opens the account sheet (with the same tabs and Archive controls). On the right sit the bell and, at the far right, the blue +, which opens the account menu (Challenges is its second row). The avatar is not on the phone header. There is no search on the phone. |
| Account | Equity, the 24h change, the sparkline, and a share icon for the performance card. |
| Readouts | Profit Target, the funded Profit: line or the tournament Rank: line, then Daily DD and Max DD side by side on one line: each a whole percentage of that allowance left, with its own bar (blue, red below 20%). It is the same row as the terminal's Account section. A limit the account does not set reads No limit with no bar; neither figure goes above 100%. Press and hold the Daily DD figure for how the day's allowance is set. A finished account shows its Result instead. |
| Markets | The price ticker. Its icon button opens a Market source sheet with Hyperliquid and TradFi. |
| Account Locked | On a breached account, the locked panel sits under the Markets ticker. The Perps Score is not on the phone Dashboard: on a phone it is on Analytics. |
| Positions | Your open positions: the market's icon, as tall as the two lines beside it, the market with its side and leverage badge (for example 10x Long), the notional size underneath in USDC, shortened and rounded down (for example 37.4k USDC, 1.2M USDC; under 1,000 the whole figure), and on the right the open P&L, white with no plus or minus sign, with the percentage under it. The account sheet's rows show each account's percentage the same way, with the triangle instead of a sign. The percentage has no sign either: a small triangle before it points up in green or down in red. Tap one for its detail (open P&L, size, notional, entry and mark price) with Manage in terminal and Share P&L. Trade, at the right of the section's heading, opens the terminal on this account. A breached account cannot trade, so its phone Dashboard has no Positions section. |
The equity curve, the month calendar and the recent-activity list are desktop panels. On a phone, use Analytics and the Calendar.
Related
- How it works - the evaluation types and their profit targets.
- Payouts - withdraw your profit share once funded.
- Analytics - your full performance breakdown and trade history.
- The Rules - the authoritative limits behind the meters.